
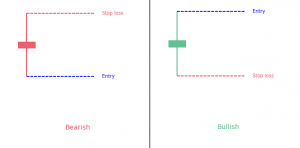
Candlestick patterns that have the same opening and closing price are known as “Doji candlestick pattern”. There are four basic types of Doji candles:
- Four-Price Doji
- Long-legged Doji
- Dragonfly Doji
- Gravestone Doji
- The Doji Candlestick is a 1-bar neutral candlestick pattern where open and close are almost equal.
- It’s a sign for indecision in the market.
- There a several specific doji patterns.
Doji candlesticks appear in a context
But these four types are different from Doji. In a scenario where we deal with a Doji candle but it does not fall in any of the above categories, it is a Doji candle. Doji gives rise to a neutral formation that suggests a state of indecision between buyers and sellers. Previous price swing or trend influence the bearish or bullish. The length of the upper shadow (wick) and the lower shadow (tail) may also vary in Doji. It appears in the shape of a plus, cross, or inverted cross.
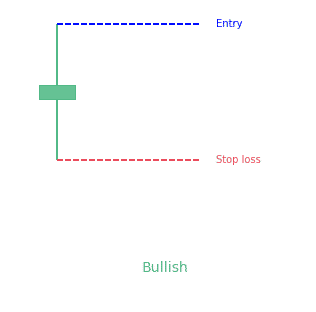
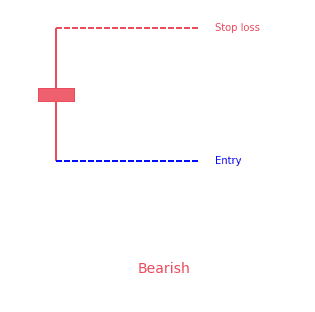
The body of a Doji pattern consists of two lines, vertical and horizontal. The vertical line is known as wick while the horizontal is named as the body. The difference between the opening and closing prices is exhibited by the body. On the other hand, the wick represents the prices. Upper wick represents top prices while lower wick tells about the bottom prices. Wicks may change according to the rise or fall of the prices but the body remains the same because of the same opening and closing prices.
How to identify the Doji candlestick pattern?
A Doji candlestick pattern forms as a direct result of a battle between the bullish and bearish traders. It is formed when the bullish traders drive the prices up while bearish traders try to push prices down. It may also form in the opposite scenario as well. That is when the bearish traders try to push the prices down while the bullish traders drive prices up. As a result of this battle, the market explores uptrend and downtrend but it does not commit to either o the direction. Hence, it reflects an equilibrium state or a state of indecision between buyers and sellers. This upward and downward movement of the prices forms the wicks. The same opening and closing prices form the body, although they remain the same.
What does the Doji pattern tell traders?
Doji candlestick pattern is a clear sign of equilibrium or neutrality. It strongly suggests that neither sellers nor buyers are gaining in this state of indecision. However, some traders believe that Doji indicates an upcoming reversal in prices when it is observed in combination with other candlestick patterns. In our opinion, it may not be the case always. However, the good point is, it is a sign that a prior trend is ending, so there is an indication of getting some profits.
How to trade when you see it?
Doji candlestick pattern manifests indecision. Therefore, after a long trend, it is the most suitable strategy to exit your position or at least scale back. Similarly, after facing a long downturn, it is reasonable to reduce the size of your position, or exit completely. However, it is advised to look for signals complementing the Doji pattern. Momentum indicators and stochastic oscillators are among the best tools to get assistance from.