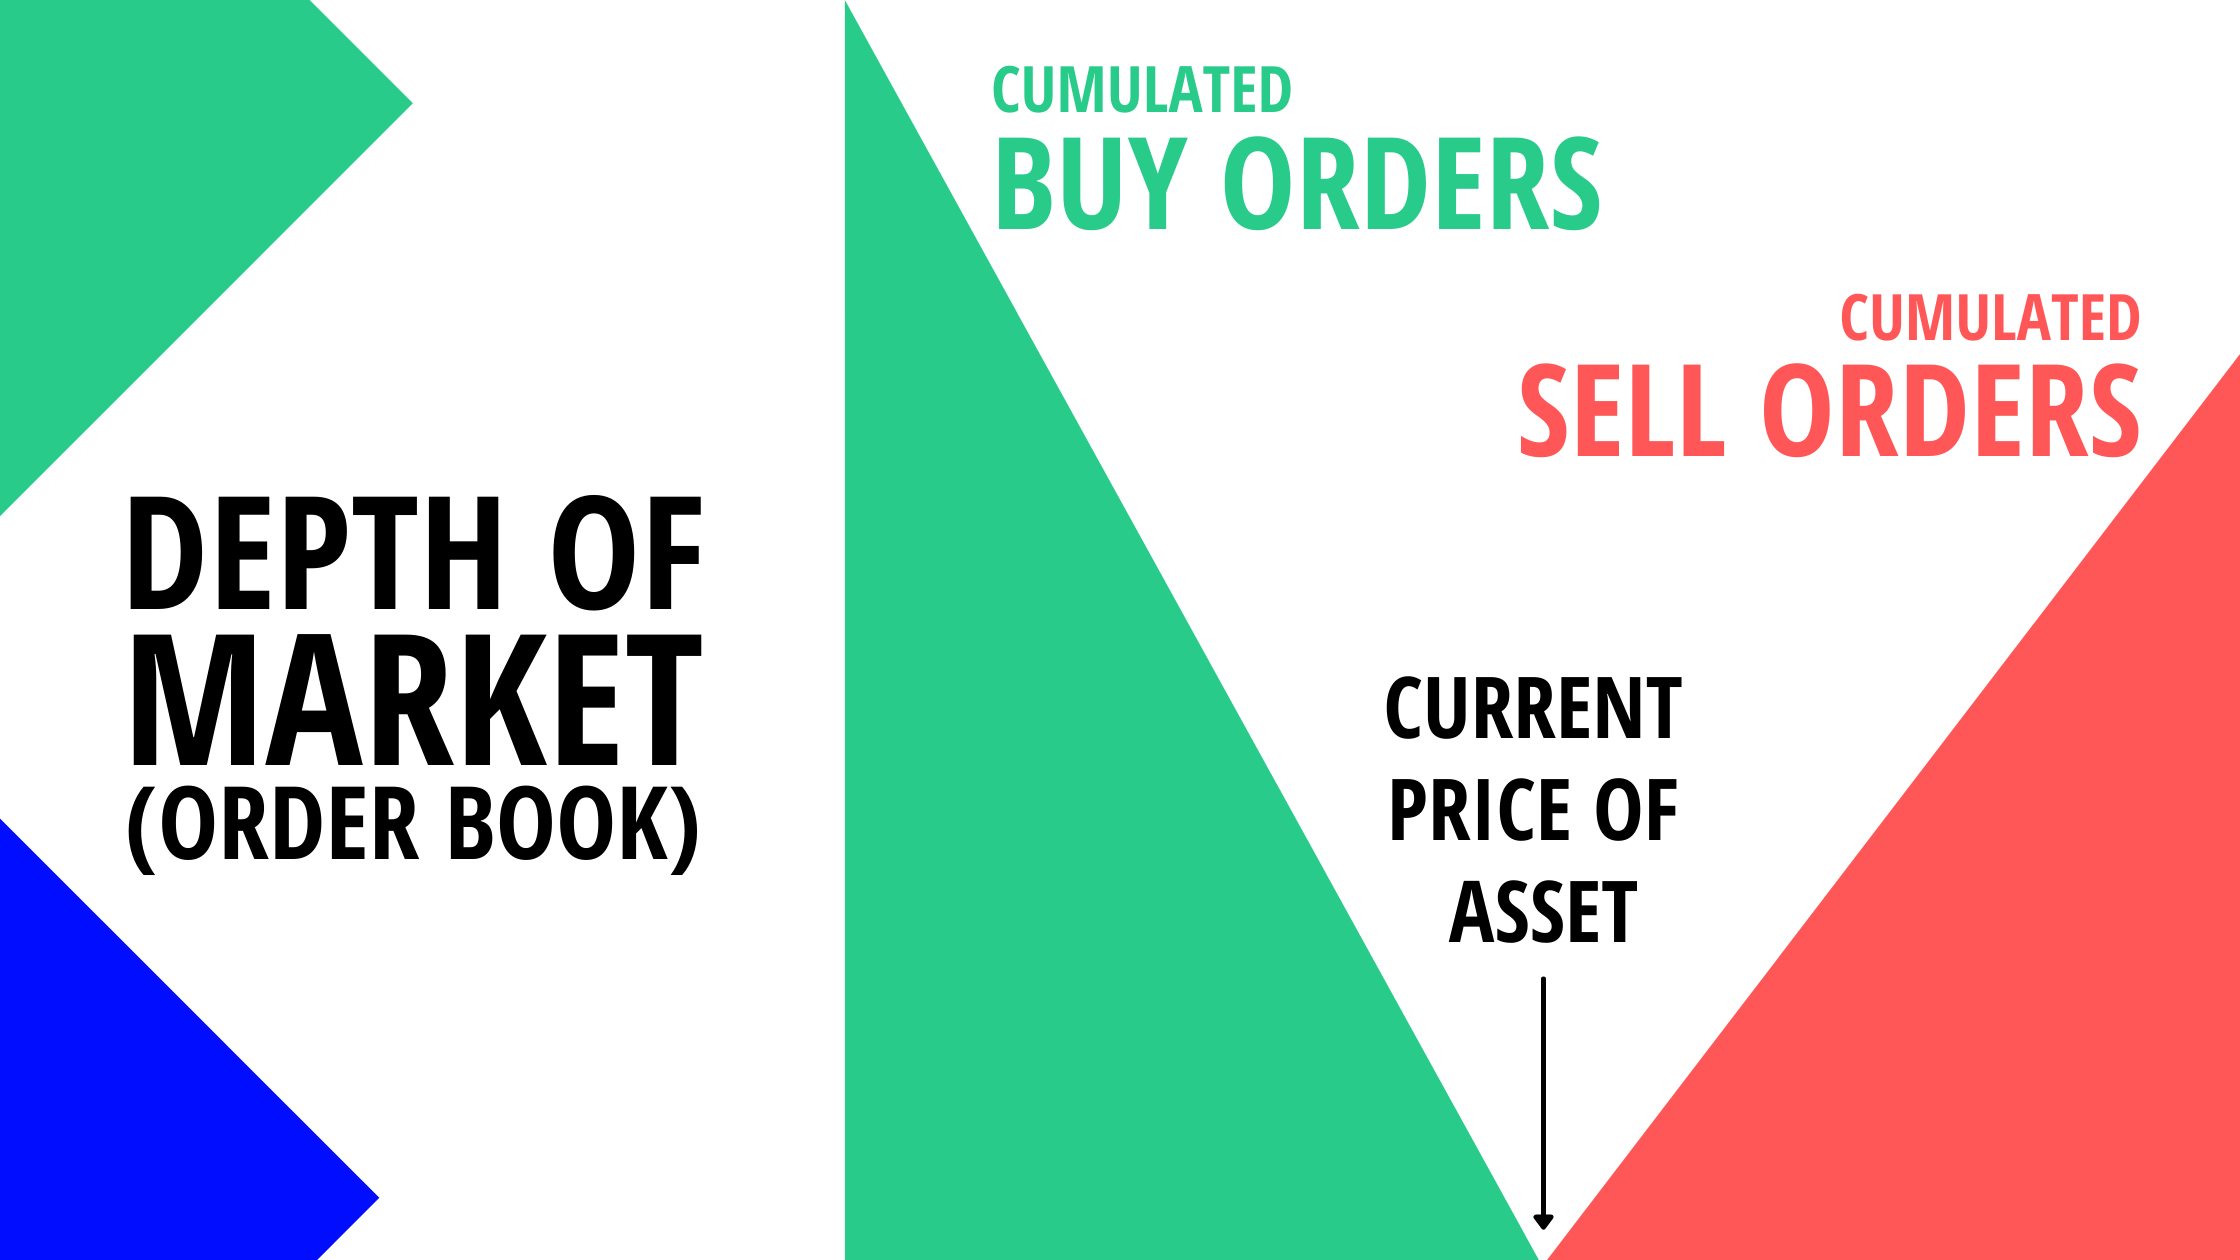
What is the Depth of Market (DOM)? How To Take Advantage of It?
Depth of Market (DOM) is an electronic list of pending orders for a particular stock or any other financial instrument. In the simplest terms, DOM is a visual display of … Read more

Volume is a key factor when analyzing price action and technical analysis.
Trading volume is a way to show how many assets were traded on any given period of time.
It plays a big role in price movement.
Each indicator tells a different story. That’s why for the same feature (here the volume on a given time period), there can be multiple indicators. Each volume-based indicator does its own computation and uses the volume only or in conjunction with other data. Technical analysis is an approach where you need many stories to point in the same direction to get confident in taking a trade.
The most famous volume indicators are the Accumulation / Distribution indicator, the On Balance Volume, the Stochastic Oscillator, the Negative Volume Index, the VWAP, the VWMA, the Chaikin Money Flow, the Volume Profile and many more.
Each of these technical indicators are very easy to add to your charts using TradingView. As you likely noticed, most of the price charts visible on our site are taken from this tool. There your chart gets updated as price and current volume change.
Click here if you want to test TradingView for free!
Volume is a great way to assess market trends on a price chart.
High volume is a clear sign that many buyers and sellers are interested in the given asset (may it be a stock, currency pair, commodity, …).
A high volume near resistance levels is a sign many traders are willing to defend this line. The same is true for a support level.
When price is moving in a trend, might it be an up or down trend, an increase in volume when price reaches new extremes is a great signal that this trend is likely to continue.
Heavy volume is a sign of strong interest from many traders in the asset at current price levels.
Low volume is a sign of low interest from the traders. It might be because traders are not interested in the asset or it might indicate price reached low interest zones. These zones can be either too high (no new buyer is willing to step in) or too low (no new seller is willing to step in).
When prices reach new highs but volume decreases, it might be a sign that buyer interest is slowing down and the up trend could reverse. The same is true for a new low but reversed (the down trend could reverse).
All these hidden interest indications are visible when you encompass a volume analysis in your trading strategy.
Here, you’ll find more than 10 volume indicators described here. Each of them can greatly integrate with chart patterns so you can increase your chance of a trade going your way.
Want to go into the details of a specific volume indicator? You’re at the right place!
Feel free to discover the detailed article for each and every volume indicator right below :
Depth of Market (DOM) is an electronic list of pending orders for a particular stock or any other financial instrument. In the simplest terms, DOM is a visual display of … Read more
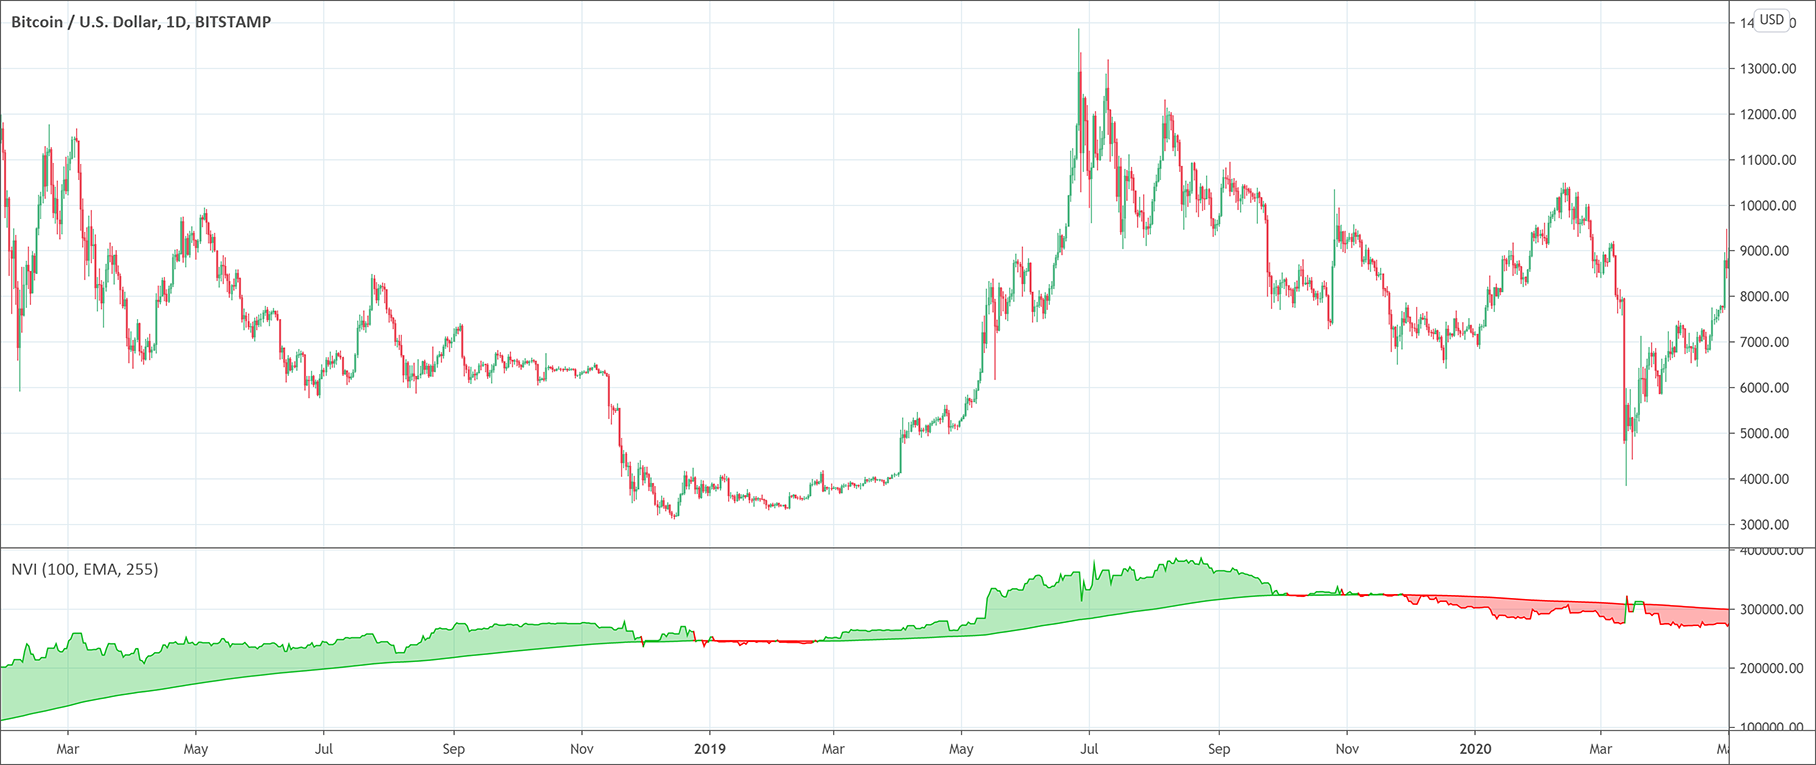
The Negative Volume Index (NVI) indicator shows how down volume days impact price. It aims at reflecting the mindset of the smart money professionals. Paul Dysart invented the Negative Volume … Read more
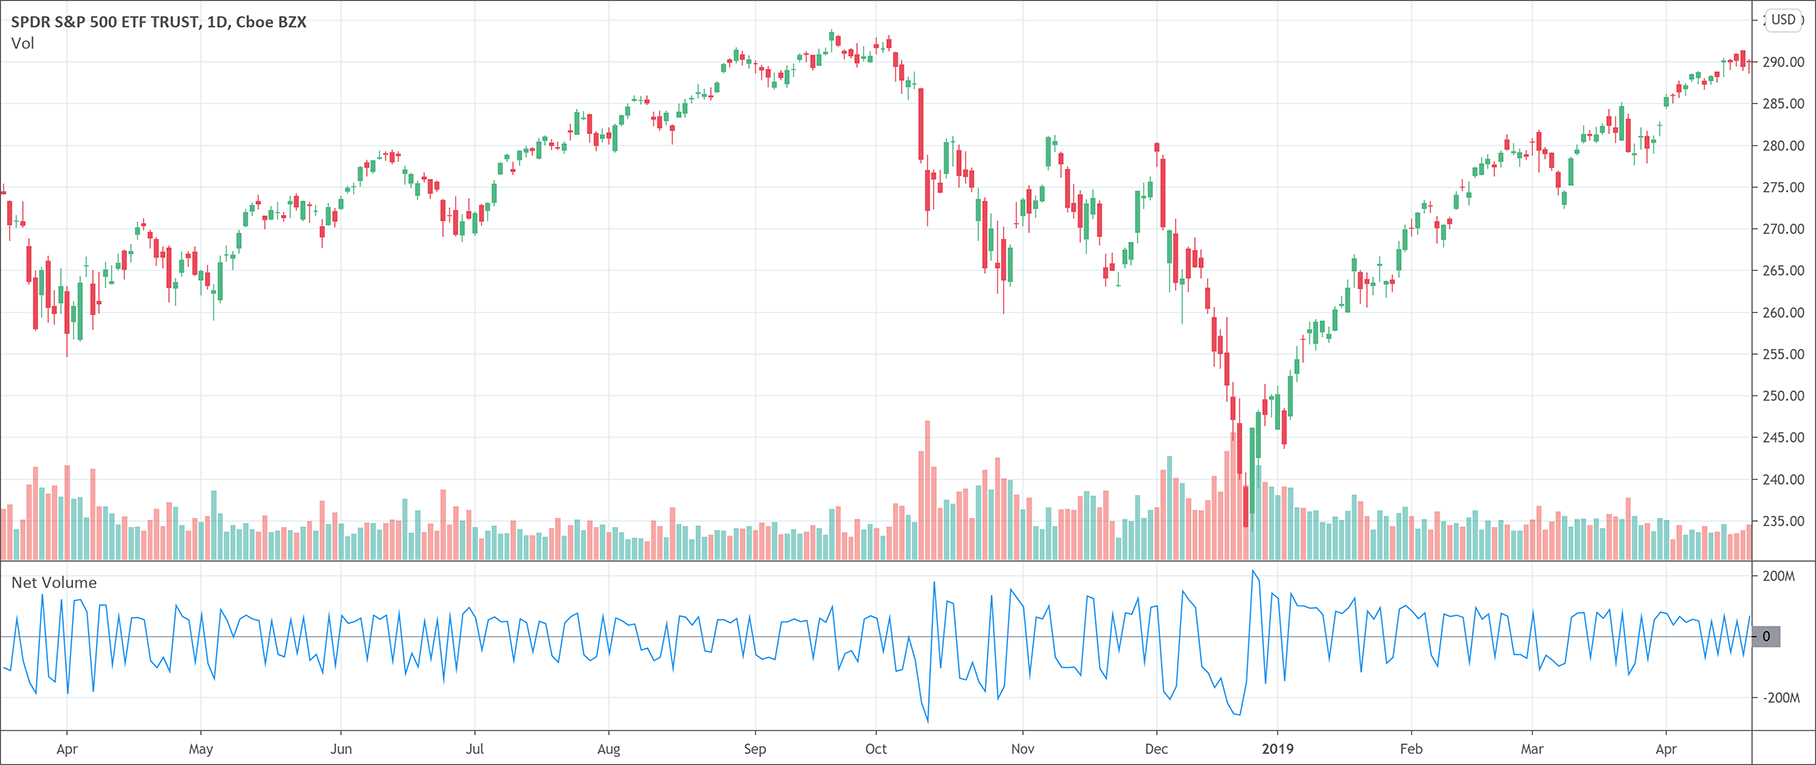
Net volume indicator is a simple technical analysis tool that works on a simple calculation. It is the difference between a security’s uptick volume and its downtick volume. A positive … Read more
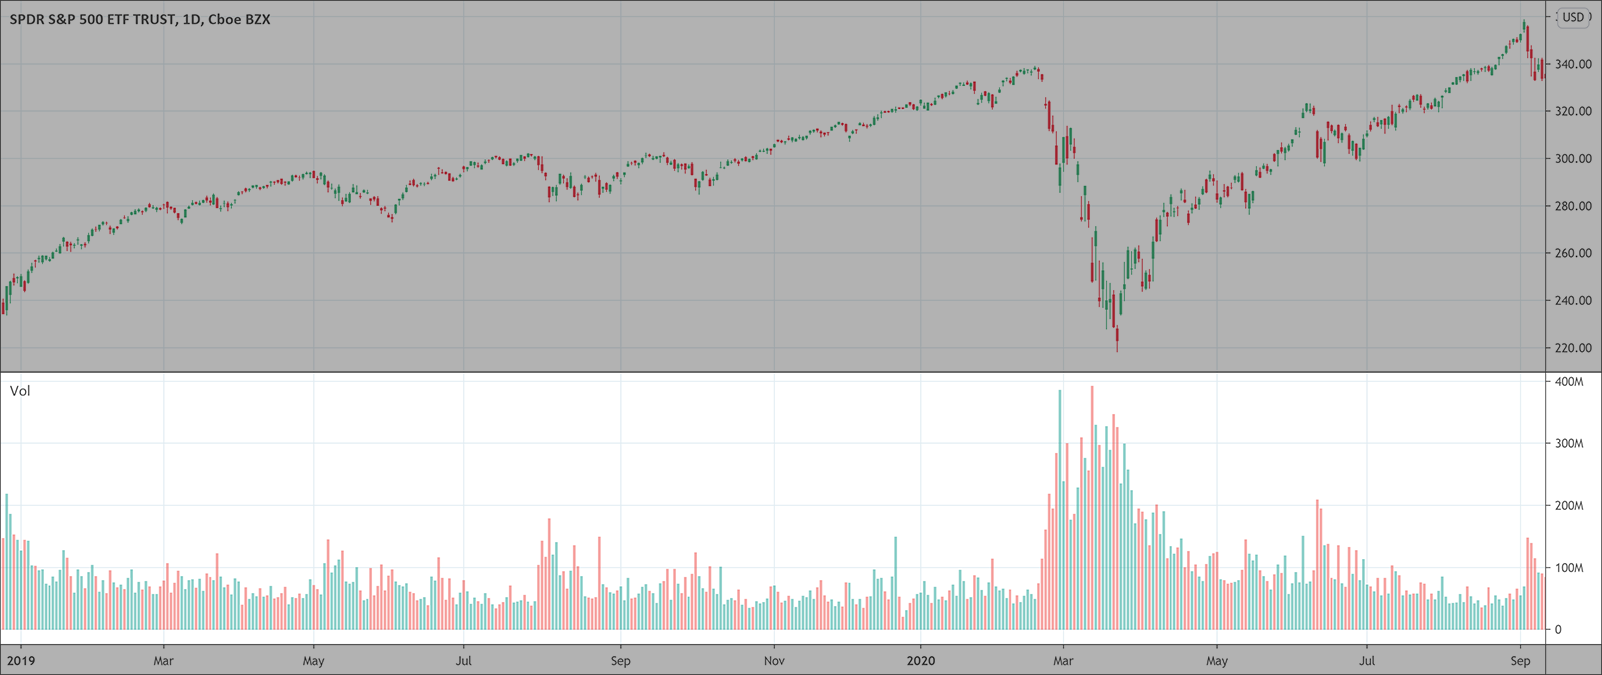
Trading volume or volume of trade is a measure of completed trades in a particular security in a given period of time. It is a measure of two very important … Read more
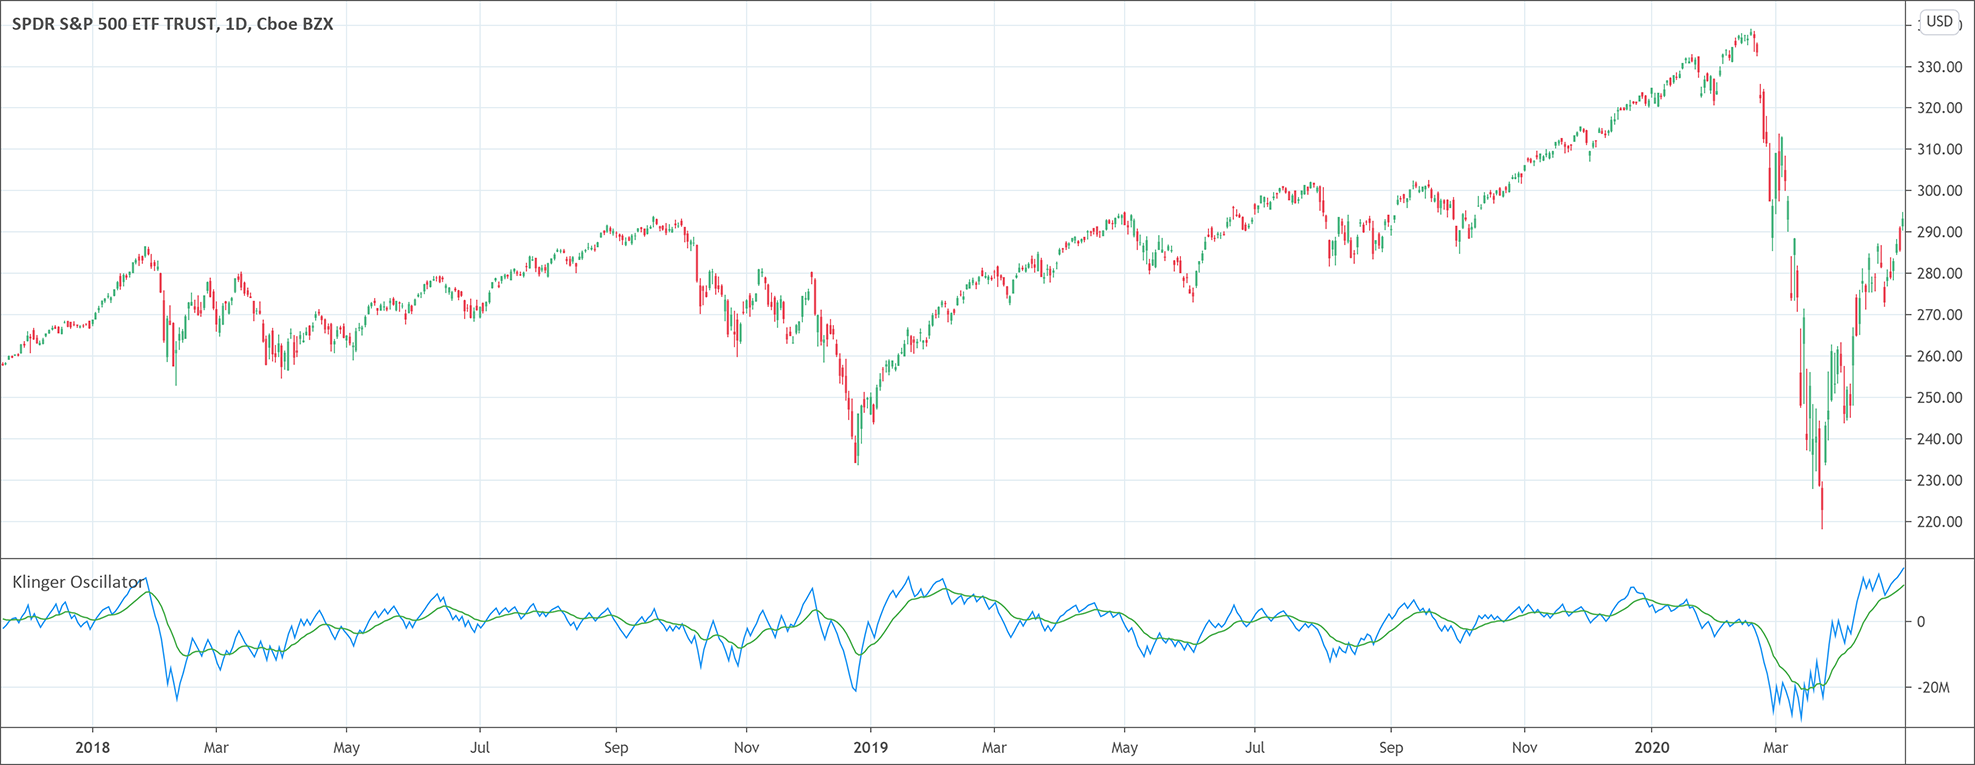
The Klinger volume oscillator is a volume-based indicator. It identifies long-term trends of money flow of a particular security. The Klinger volume oscillator is a volume-based indicator that functions to … Read more
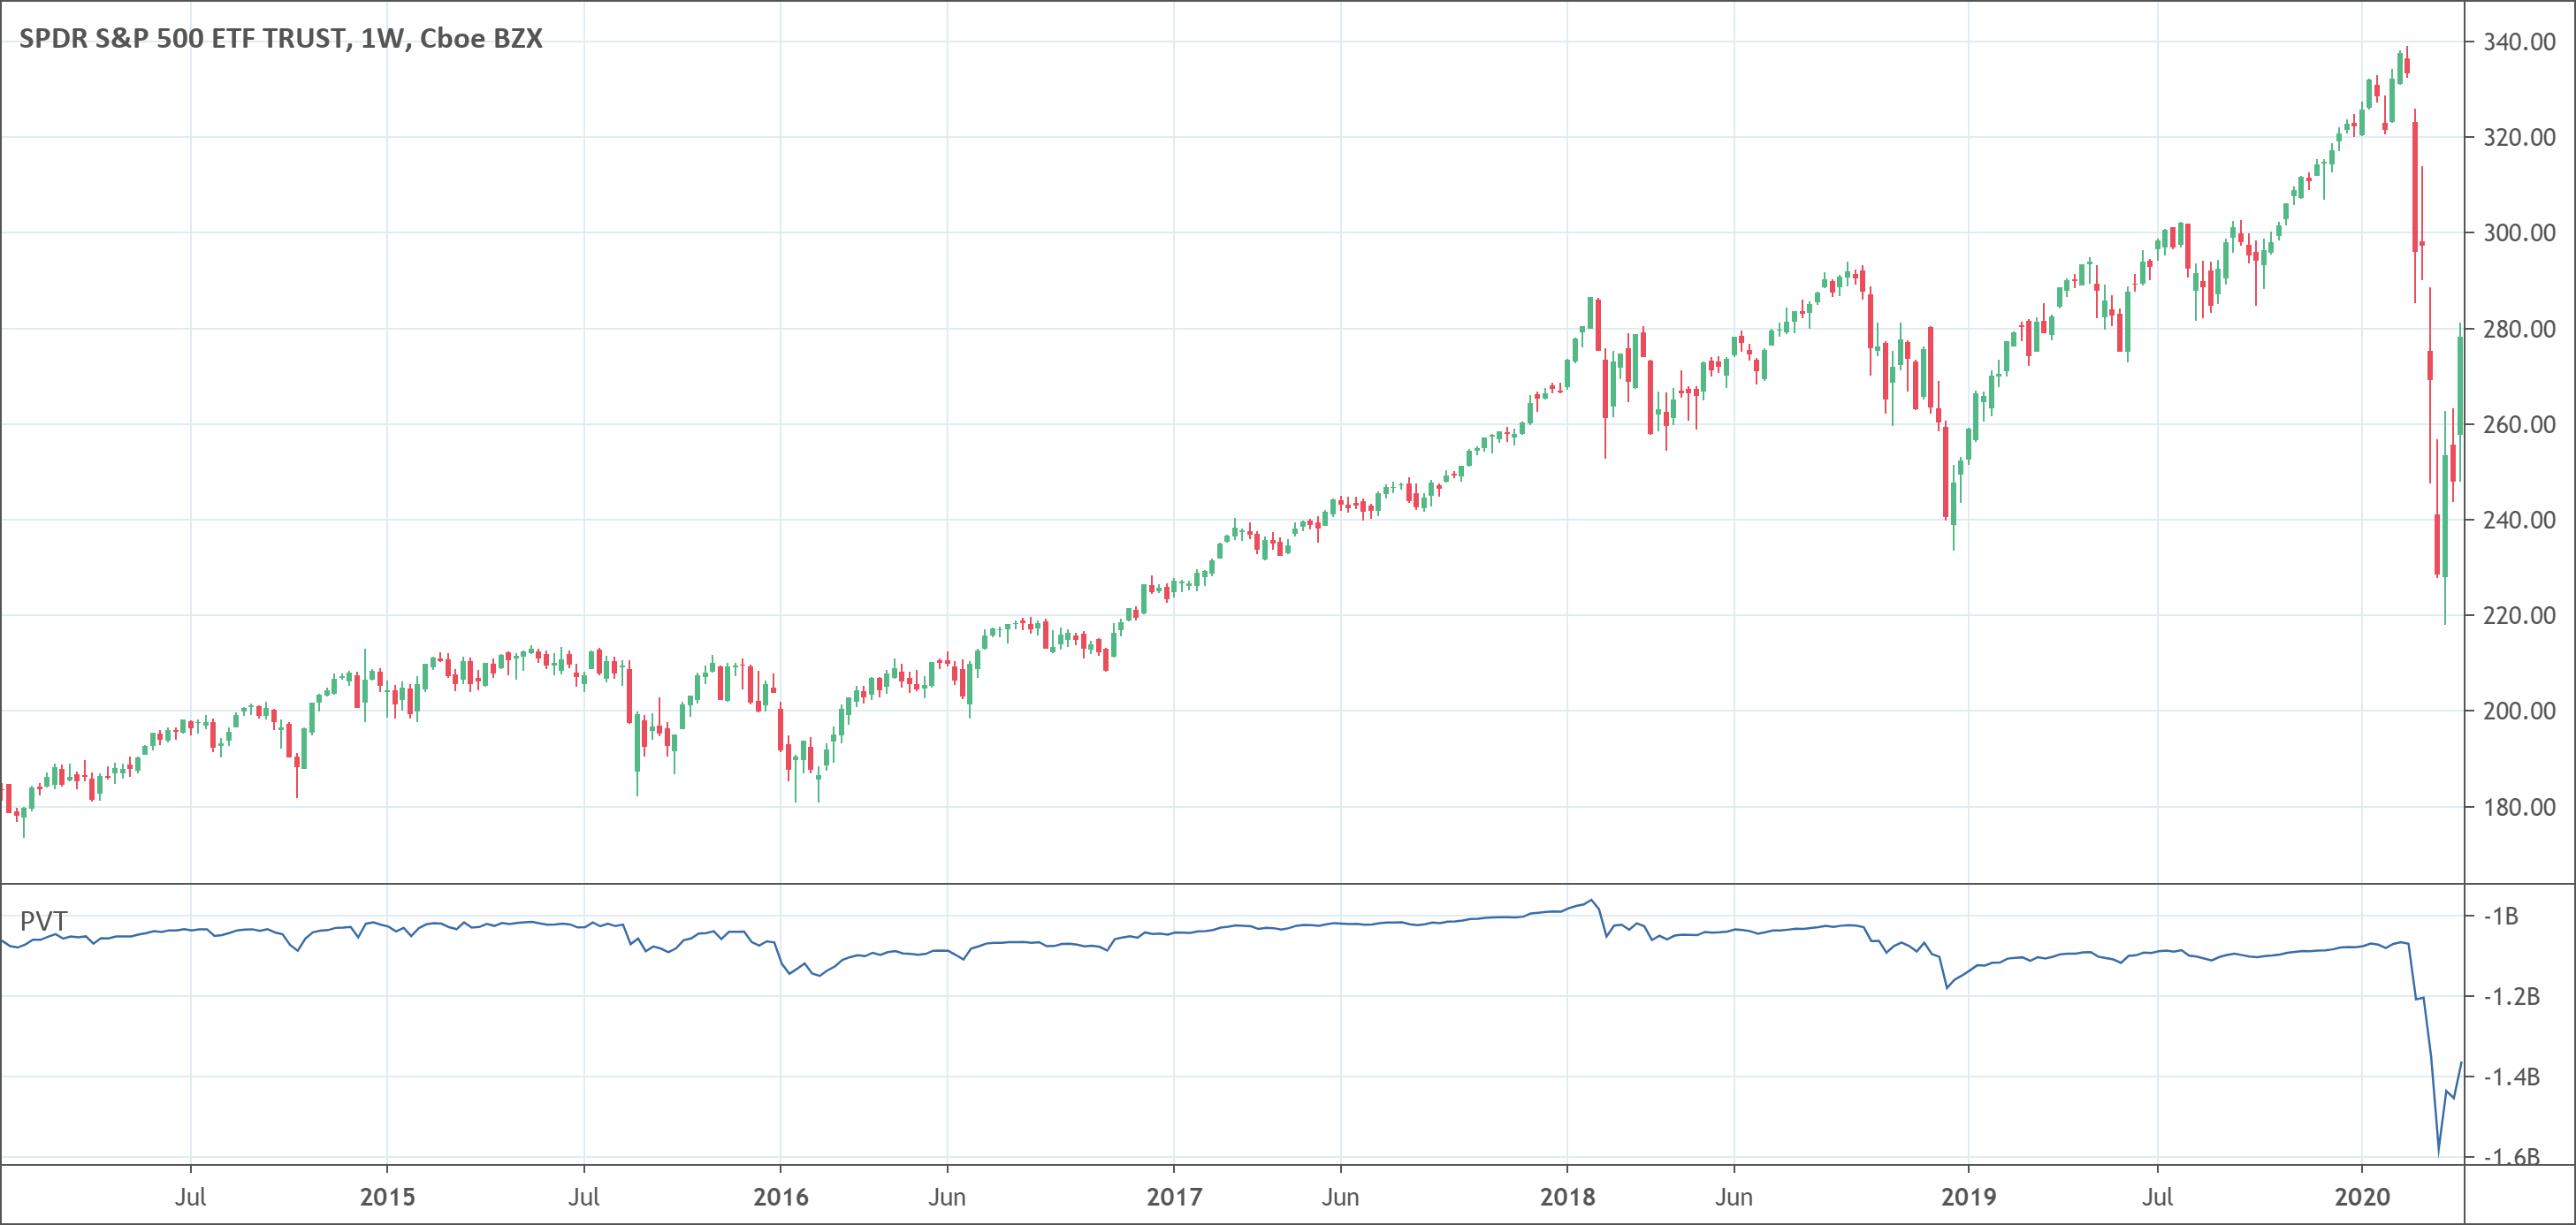
The Volume Price Trend is a volume momentum indicator. It makes use of both percentage changes in price and volume. It uses them to confirm the strength of the trend … Read more
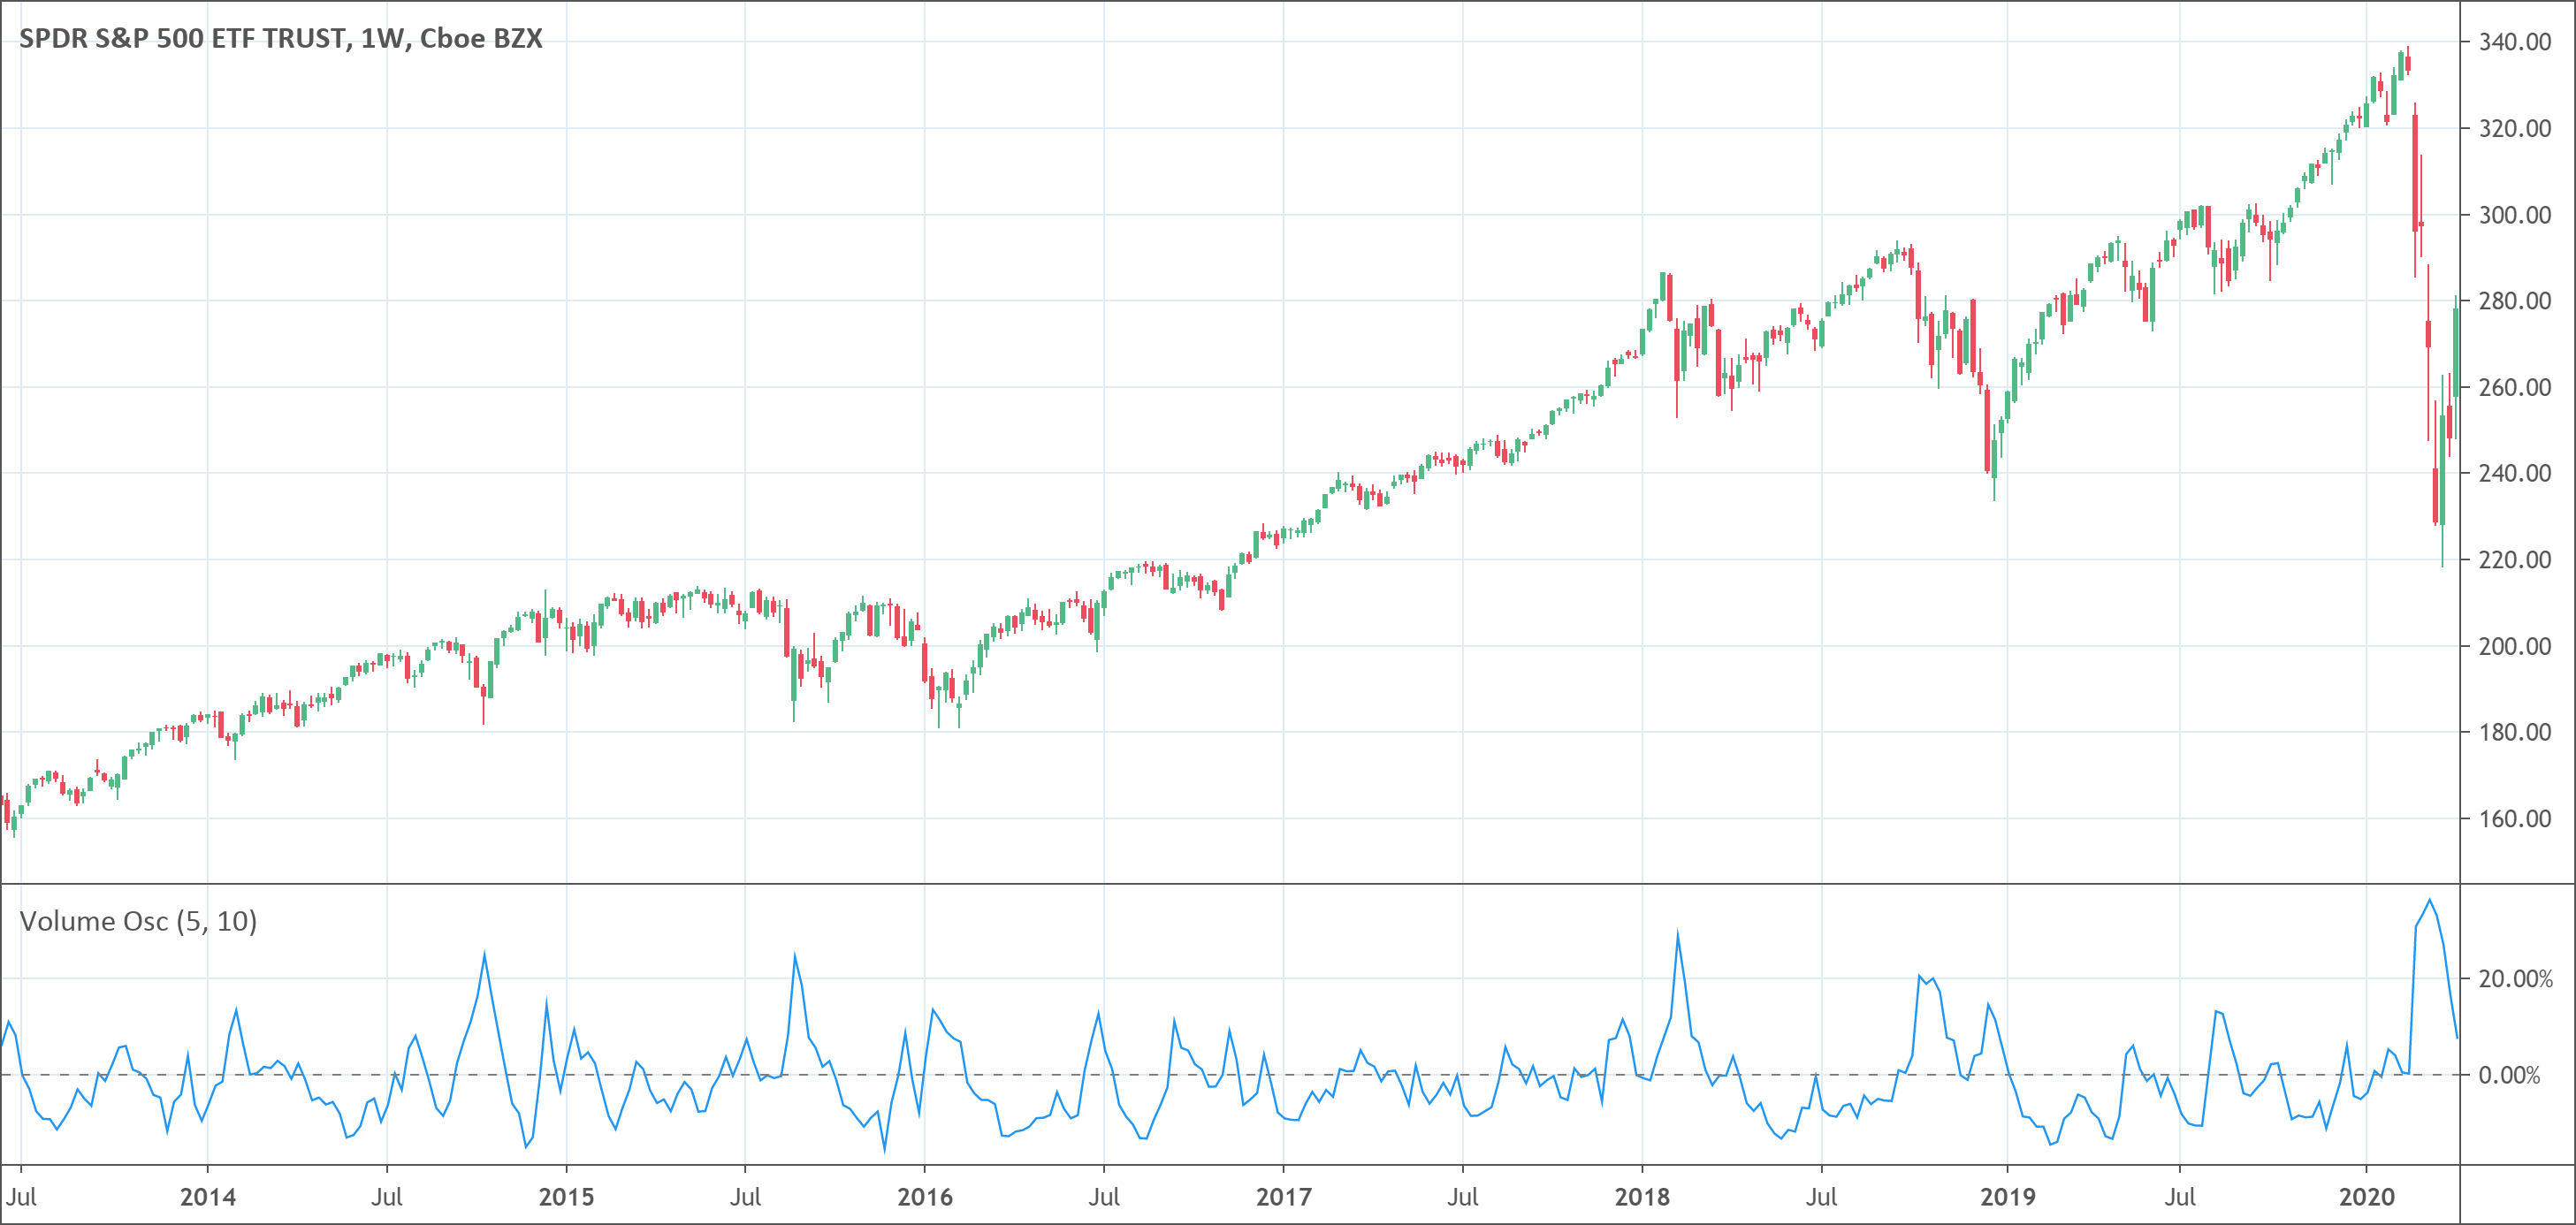
The Volume Oscillator identifies the trend in volumes with a system of two Exponential Moving Averages.. The Volume Oscillator is made up of two moving averages of volume, one fast … Read more
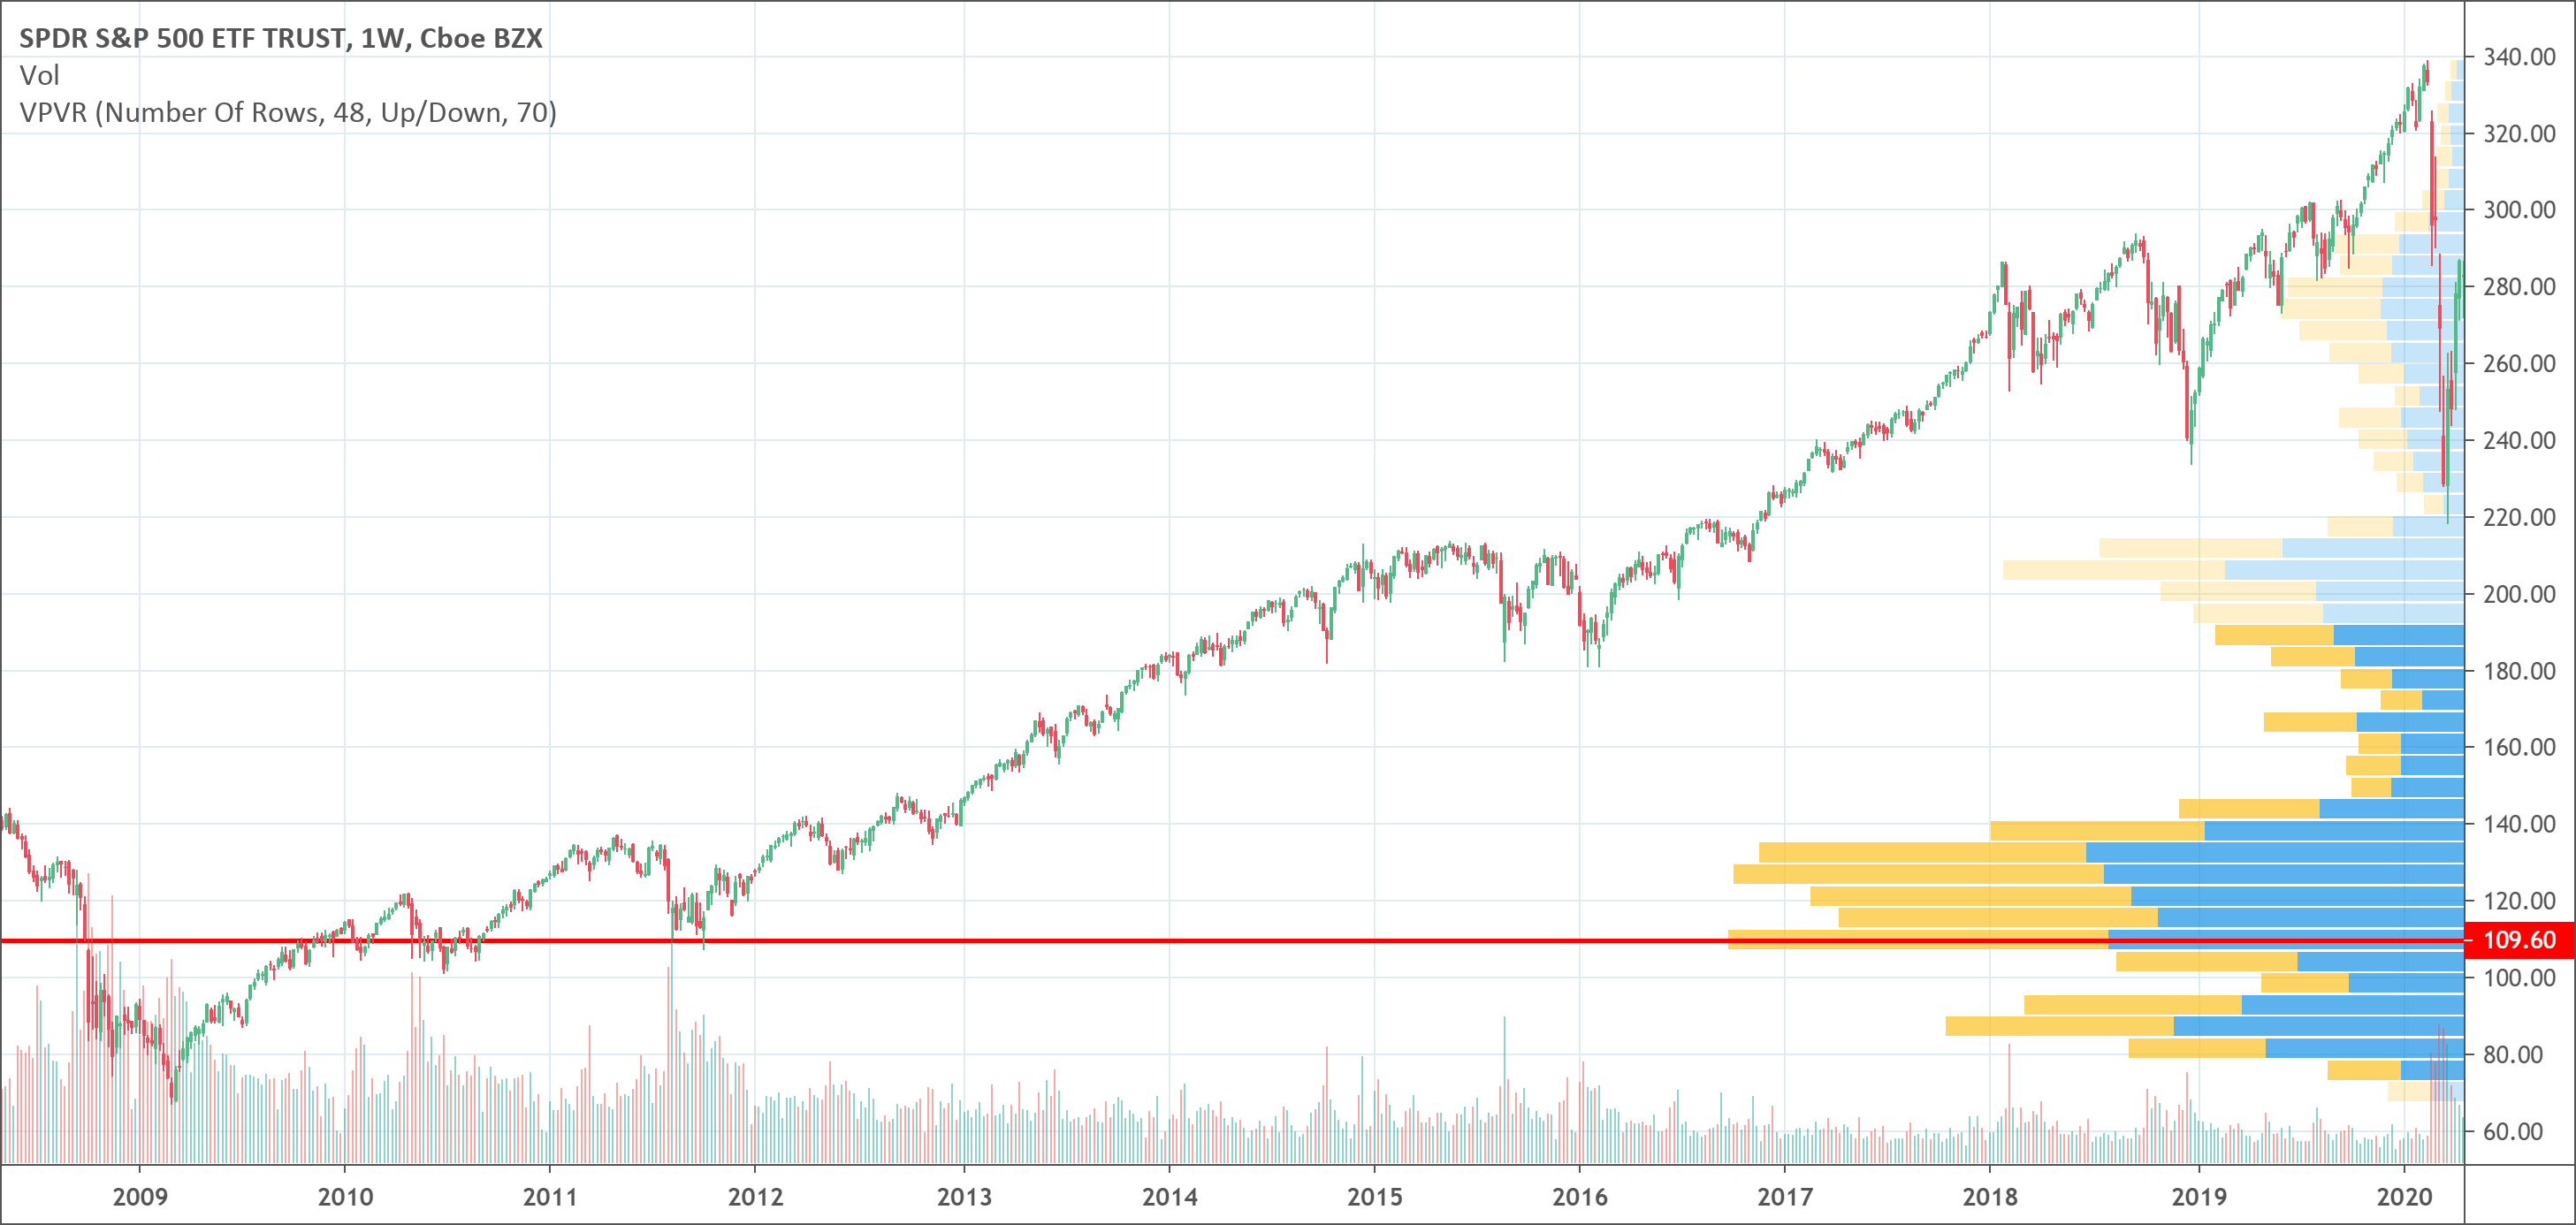
Volume Profile shows the price where the security was most traded. It takes a given range for computation (either visible or fixed). The more volume traded at a given price, … Read more
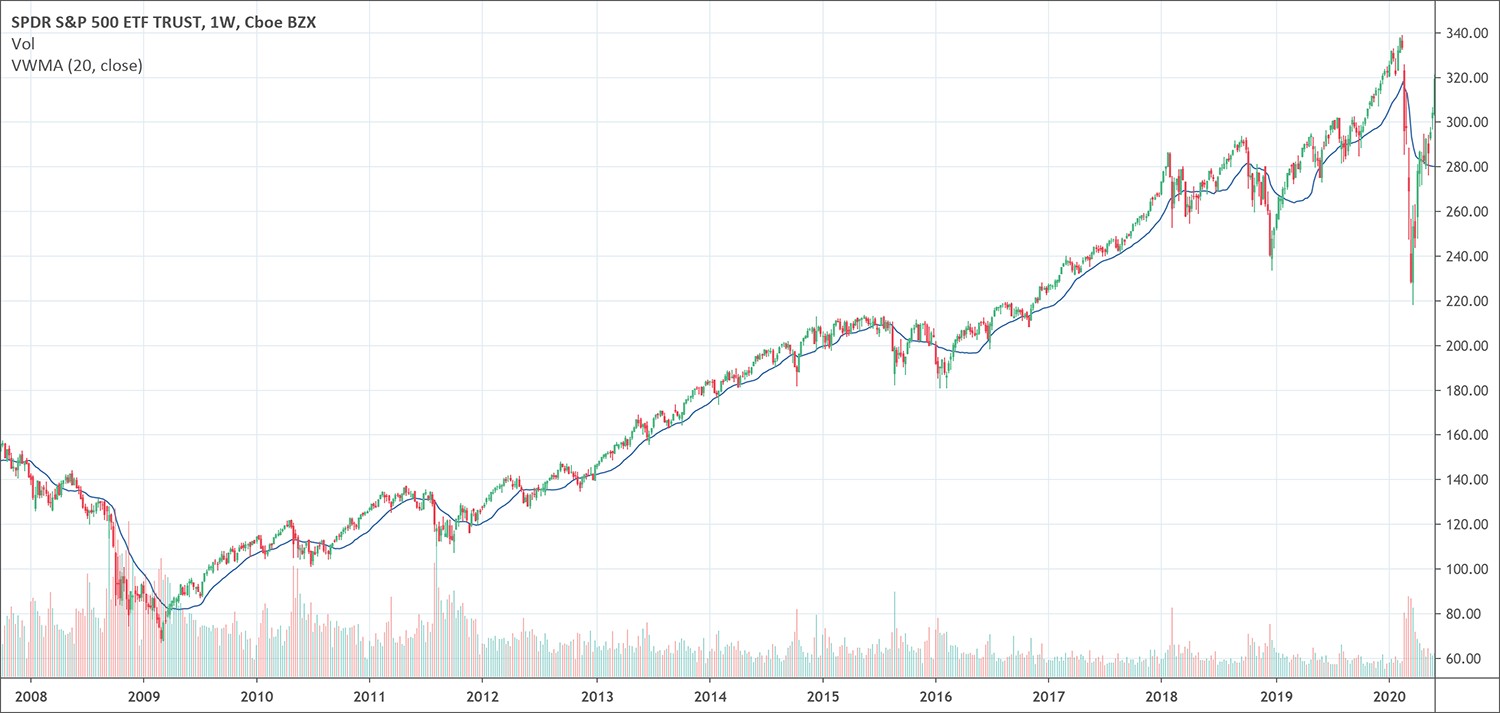
If you have an interest in financial trading, you must have knowledge of two concepts, moving averages and volume. Moving averages is one of the most common and widely used … Read more
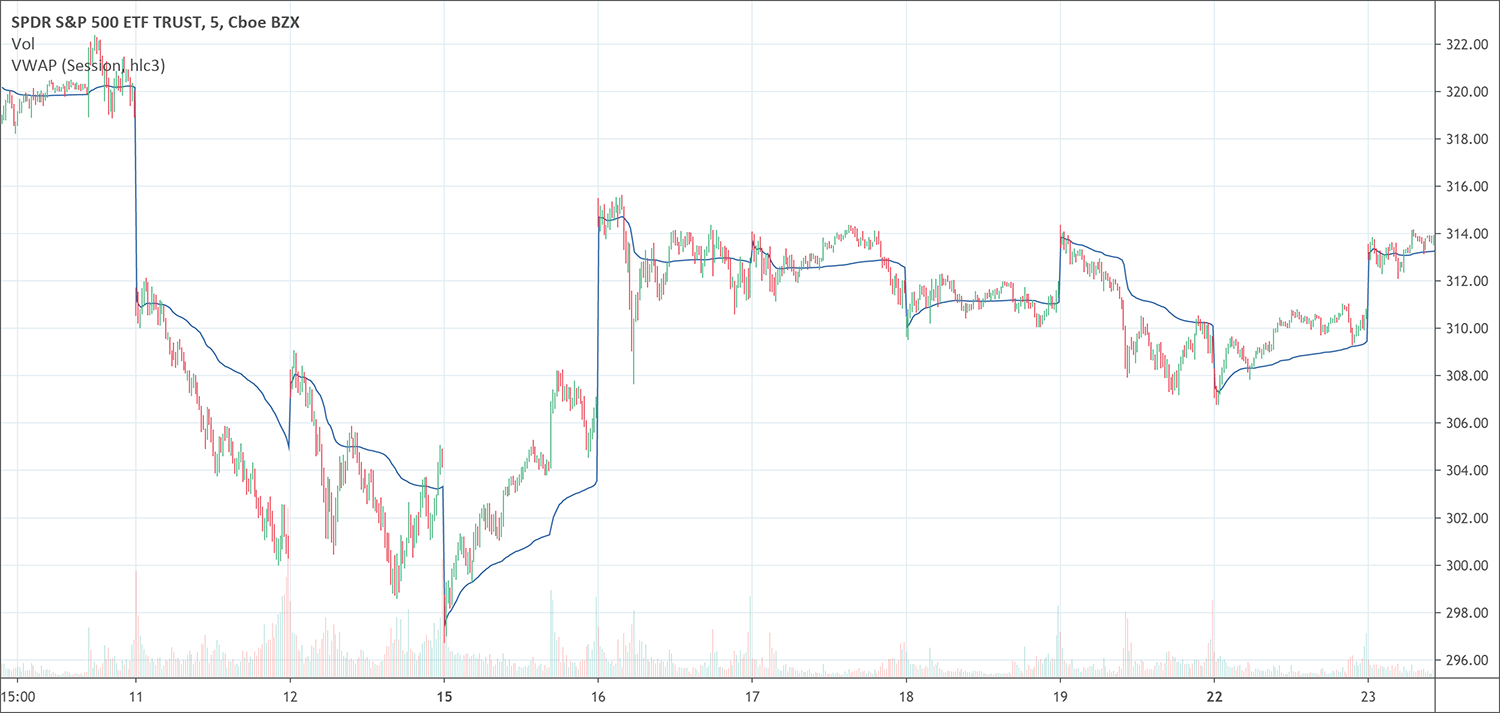
There are various technical indicators that have made the analysis of the financial markets remarkably easy. Some of them work with the objective of finding momentum. Others aim to find … Read more
We research technical analysis patterns so you know exactly what works well for your favorite markets.
© PatternsWizard | Crafted with care by traders for traders
Trading is not appropriate for all investors, and the risks can be substantial. You agree and acknowledge further that the trading signals and contents provided to you by PatternsWizard are not, and are not intended to be, an offer or solicitation to enter into any transaction, or any type of trading or investment advice, recommendation or strategy. You acknowledge that it is solely your decision to determine which, if any, PatternsWizard trading signals and contents to use for trading (whether actual or simulated). Statistics provided are the result of backtests and are provided as is with no guarantee. Past performance is no guarantee of future results. Trading PatternsWizard signals may result in losses. Leverage can work against you as well as for you, and can lead to large losses as well as gains. You should only trade with funds that you can afford to lose. Based on the foregoing, you agree that you shall not seek to hold PatternsWizard, its managers or its developpers responsible for any losses associated with any trading signals or contents provided to you by PatternsWizard. CFDs are complex instruments and come with a high risk of losing money rapidly due to leverage. Between 74-89 % of retail investor accounts lose money when trading CFDs. You should consider whether you understand how CFDs work and whether you can afford to take the high risk of losing your money. PatternsWizard is for education purposes only.
Some of the links in this site are affiliate links. It means these websites will pay us a small commission at no additional cost to you if you buy from them.
PatternsWizard is NOT FINANCIAL ADVICE, trade responsibly.