
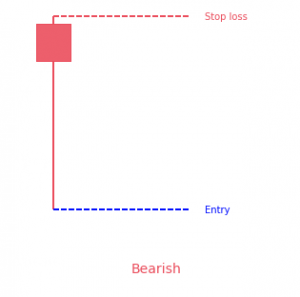
As the name suggests, the Hanging Man candlestick pattern is a bearish sign that appears in uptrends. On occasions, it also tells traders about the upcoming price reversal. The experts of the domain suggest that the Hanging Man pattern must be taken as a warning, not just a signal, of potential changes in the prices.
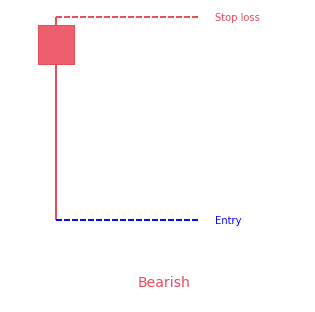
The Hanging Man candlestick pattern has a body that is shorter and flat at the top. It has a longer lower wick (shadow) and a very little or no upper wick at all. The long lower wick exhibits volatility and the wide range of intra-day trading. Its shorter body suggests that opening and closing prices remained close to each other. However, experts claim that the longer lower wick must be longer than the body of the pattern. They also suggest that the body should also be above the intra-day trading range. Only then, it will be a valid Hanging Man pattern.
- The Hanging Man pattern is a 1-bar candlestick bearish reversal pattern.
- It has a short body and a long lower tail which should be at least twice the size of the body.
- It appears after a bullish advance in price.
Statistics to prove if the Hanging Man pattern really works
Are the odds of the Hanging Man pattern in your favor?
How does the Hanging Man behave with a 2:1 target R/R ratio?
From our research the Hanging Man pattern confirms 37.2% of the time on average overall all the 4120 markets we analysed. Historically, this patterns confirmed within 4.3 candles or got invalidated within 3.6 candles. If confirmed, it reached the 2:1 R/R target 35.8% of the time and it retested it's entry price level 81.8% of the time.
Not accounting for fees, it has an expected outcome of 0.075 $/$.
It means for every $100 you risk on a trade with the Hanging Man pattern you make $7.5 on average.
Want to account for your trading fees? Have the detailled stats for your favorite markets / timeframes? Or get the stats for another R/R than 2:1?
🚀 Join us now and get fine-tuned stats you care about!
How to handle risk with the Hanging Man pattern?
We analysed 4120 markets for the last 59 years and we found 170 123 occurrences of the Hanging Man pattern.
On average markets printed 1 Hanging Man pattern every 92 candles.
For 2:1 R/R trades, the longest winning streak observed was 51 and the longest losing streak was 396. A trading strategy relying solely on this pattern is not advised. Anyway, make sure to use proper risk management.
Keep in mind all these informations are for educational purposes only and are NOT financial advice.
If you want to learn more and deep dive into candlestick patterns performance statistics, I strongly recommend you follow the best available course about it. Joe Marwood (who's a famous trader with more than 45 000 Twitter followers) created an online course called "Candlestick Analysis For Professional Traders" in his Marwood Research University. There he will take you through the extensive backtesting of the 26 main candlestick patterns. He then summarizes which one is THE best pattern. Do you know which one it is?
Remember, don't trade if you don't know your stats. Click here to signup to the course now!
PS: Save 20% with the SAVE20 code.
How is the Hanging Man candlestick pattern formed?
It is very interesting to know that it closely resembles the Hammer, Inverted Hammer, and the Shooting Star candlestick patterns. This resemblance, especially to Hammer candlestick pattern, is amazing. Just like the Hammer, its formation also begins when the following two conditions are fulfilled
- When open, close, and high prices are almost similar
- The long lower shadow is at least twice bigger than the body
When these two conditions are fulfilled, a bearish Hanging Man candlestick pattern is formed. When opening and high prices are the same, it is considered to be the strongest bearish sign for the traders. On the contrary, when closing and high prices are the same, it is considered less bearish.
How to identify the pattern?
It is comparatively easy to identify Hanging Man. As we have discussed earlier, it has a small body and a long lower shadow. And the shadow, as the name “Hanging Man” suggests, hangs completely below the body. It appears on the uptrend and usually, it breaks a most recent high or it is very close to a recent high. Another important hint is that its top meeting a resistance area.
What does the Hanging Man candlestick pattern tell traders?
It tells to the traders through visual evidence that the buyers are failing to keep the prices high. It acts as a warning that buyers are losing the battle. Even if buyers are somehow able to keep the prices high, large sell-off continues to drag prices lower. Hence, the Hanging Man candlestick pattern tells the traders about the first phase of selling pressure during an uptrend. However, on many occasions, it can also indicate a warning sign for current long positions.
How to trade when you see the Hanging Man candlestick pattern?
Traders can take full advantage of the Hanging Man pattern. Once you have the evidence that tells the trend is close to the end, you should look at those levels where you may close your trade. On the contrary, when the uptrend is about to end and there is evidence of a potential reversal, it is the best opportunity to make profits. Moreover, as per your trading strategy, you may also consider incorporating the Hanging Man pattern as a sell signal.
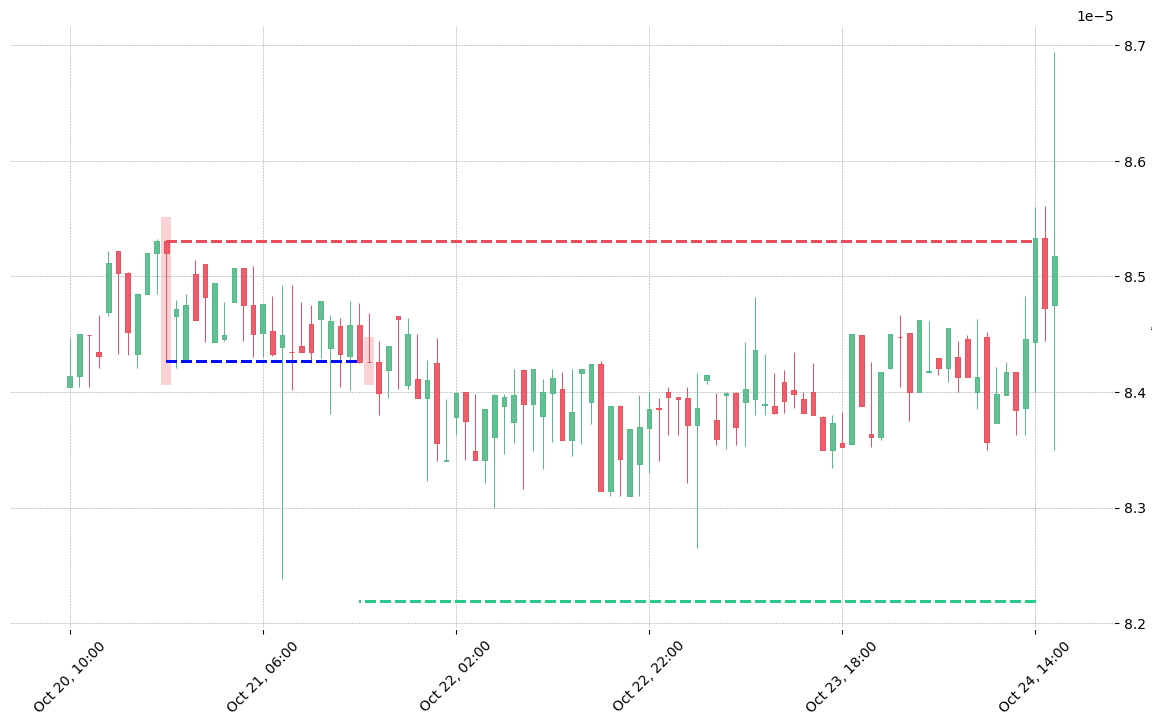
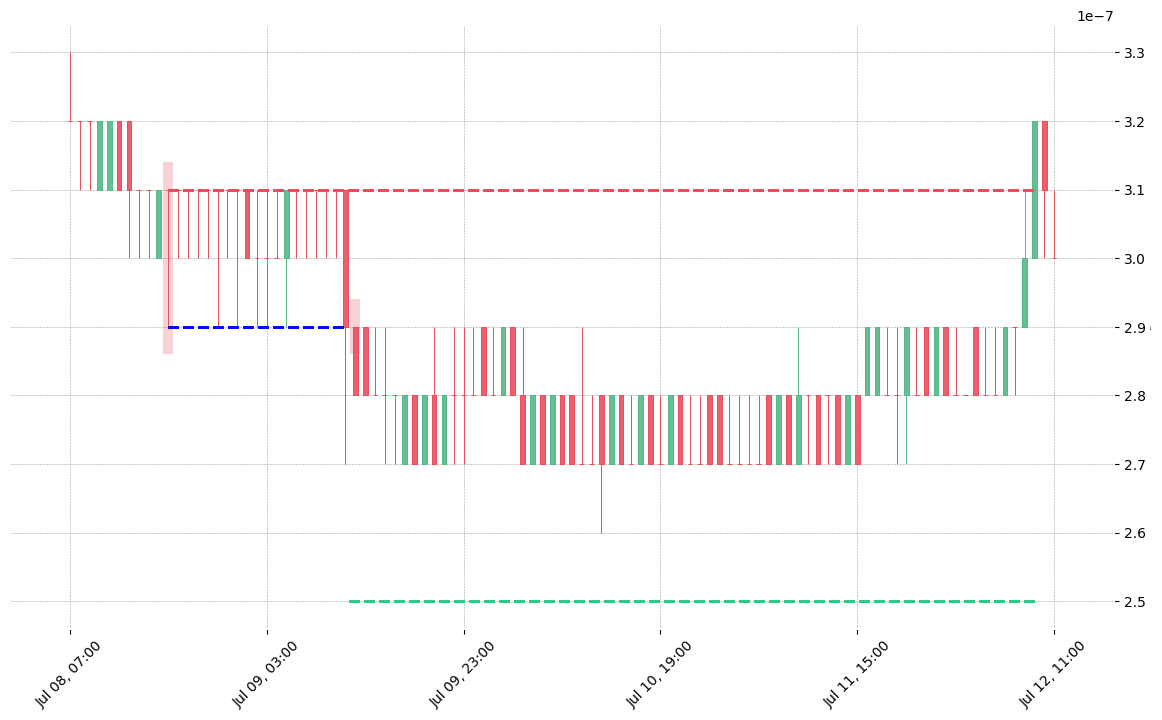
How does the Hanging Man pattern look in real life?
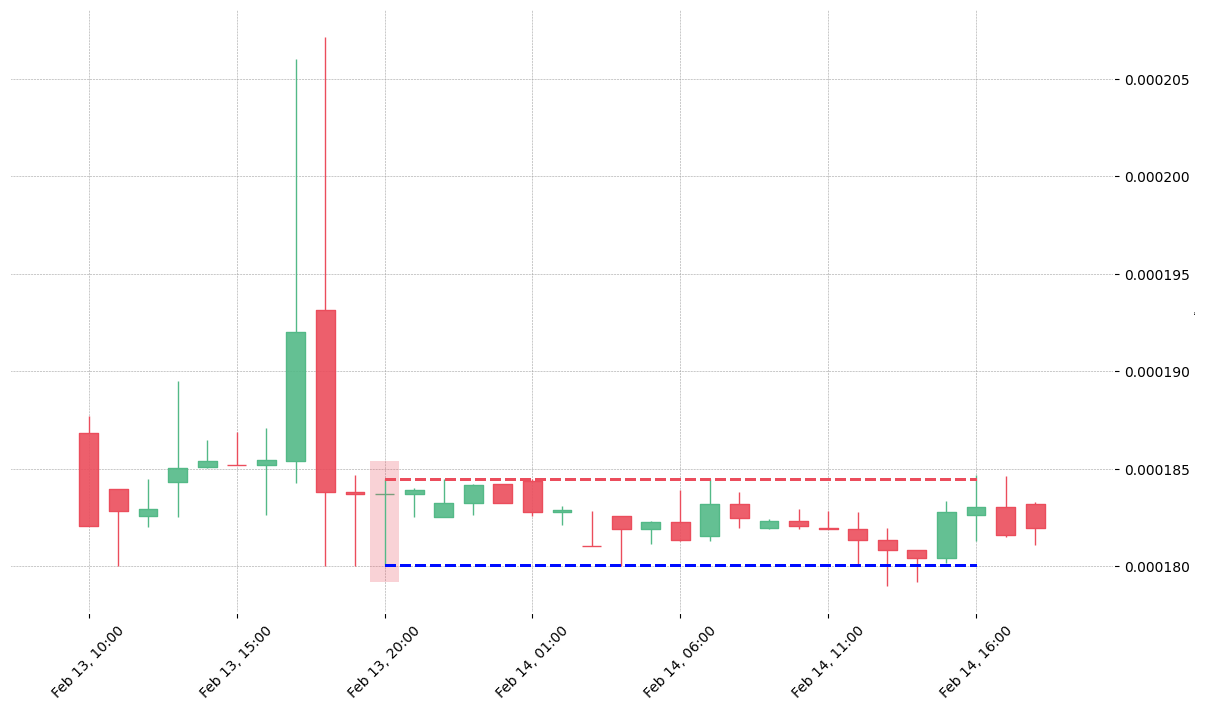
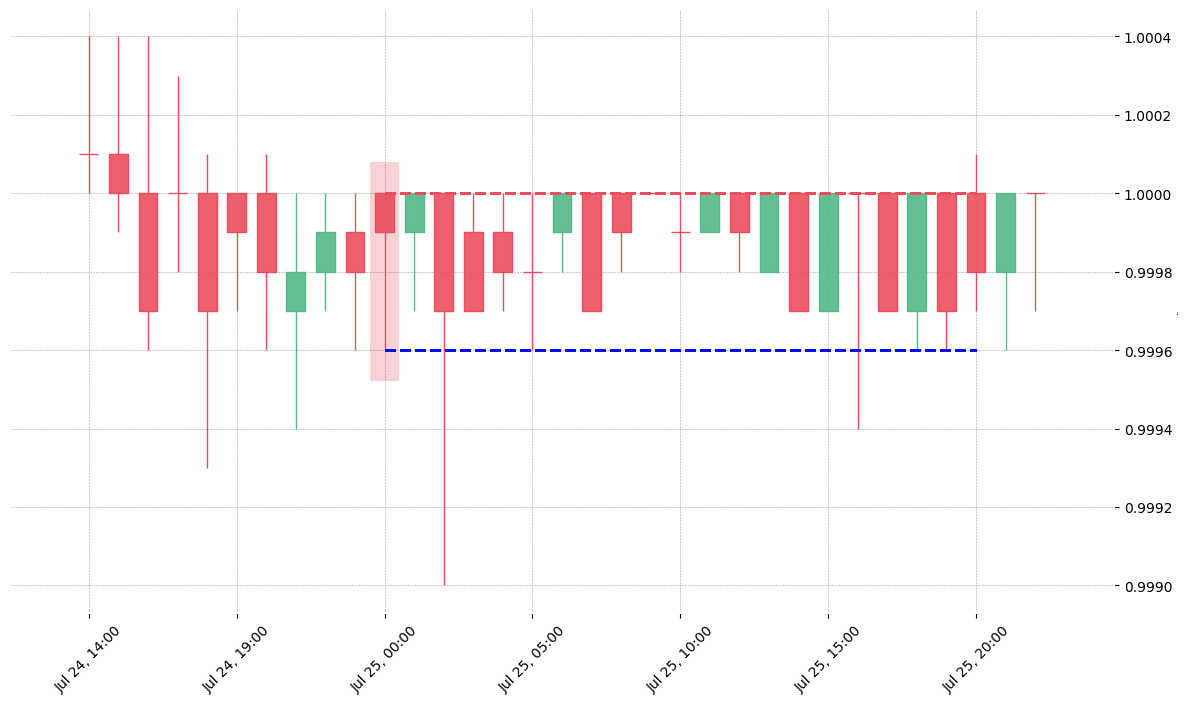
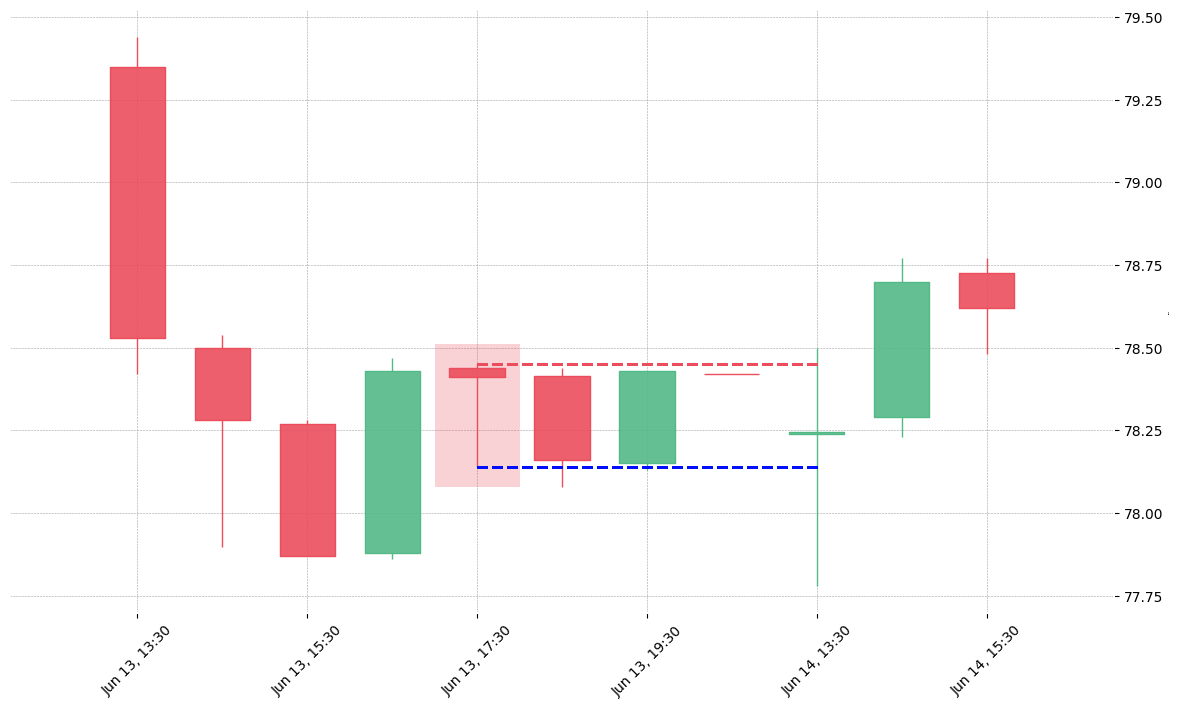
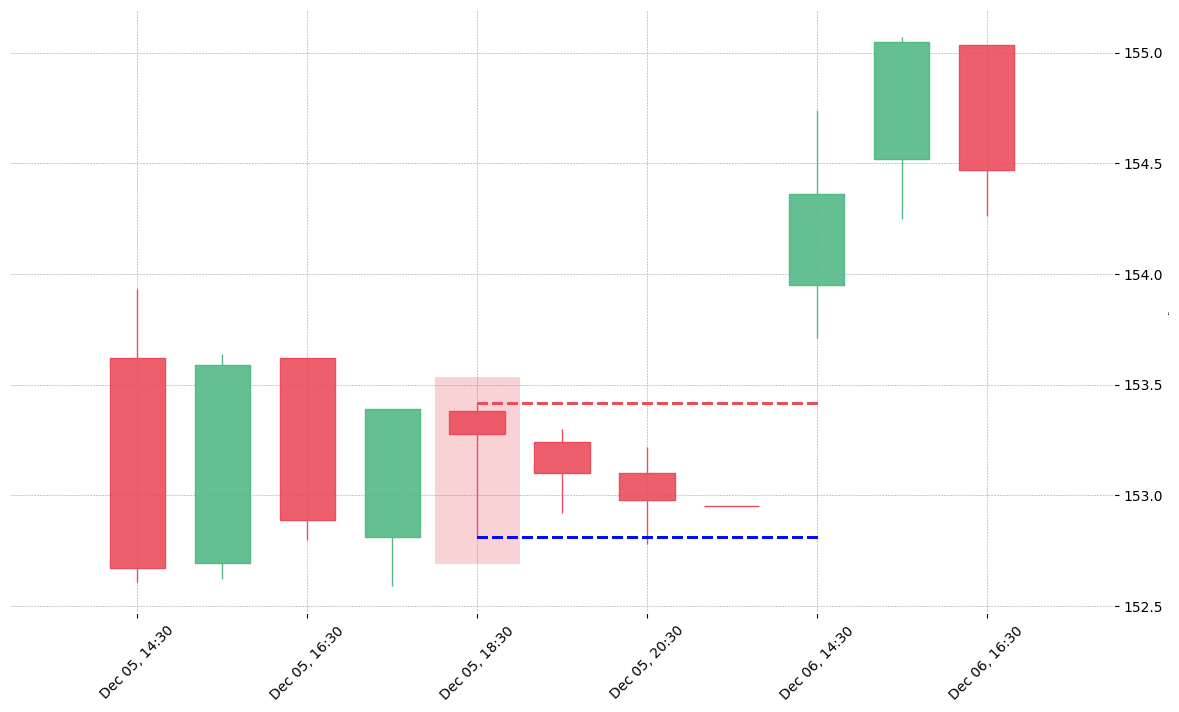
Looking to learn more about this pattern?
You should take a look at Joe Marwood's online course. In his course, he backtested the 26 main candlestick patterns before to summarize which one is THE best pattern. I really liked his course and you shouldn't miss it!
Click here to signup to his "Candlestick Analysis For Professional Traders" course now!
PS: Save 20% with the SAVE20 code.