
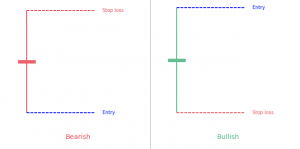
Candlestick patterns are becoming more and more popular these days for charting prices. They are easy to detect with their colorful bodies and black wicks and easy to observe the ways and the behavior of the market. One such popular candlestick pattern is the Long-Legged Doji candlestick pattern. As it is obvious from the name, it has a long leg on both sides, upside, and downside. It has a body that is so tiny or almost non-existent. It signals an upcoming reversal of the current trend. Like the other Doji patterns, it also exhibits the uncertainty in the market.
It is important for the traders to realize that Long-Legged Doji candlestick patterns appear during a specific market event. The nature of Long-Legged Doji alludes towards the potential trading opportunities for the traders. Although it looks very similar to other Doji patterns, it has something unique and meaningful, especially whenever and wherever it appears on the price chart.
- The Long-Legged Doji is a 1-bar candlestick pattern.
- It has a small body and long upper and lower shadows.
- It reflects indecision in the market.
How to identify the Long-Legged Doji candlestick pattern?
It is easy to identify a Long-Legged Doji candlestick pattern because of its particular shape. It has the fundamental three aspects that help to identify it.
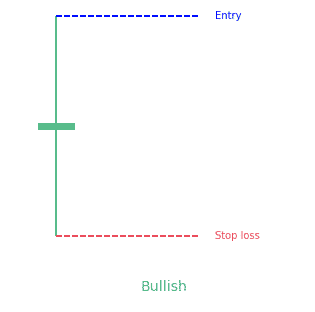
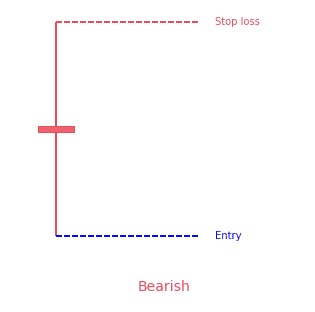
- A tiny or almost absent body that illustrates that opening and closing prices are the same or almost same with a difference of just a few pennies
- Opening and closing prices are located right in the middle of the range of the candle
- Very long wicks
What does this pattern tell traders?
Every candlestick pattern tells a very unique tale about the ways and behaviors of the market. Such information about the market is always crucial for the traders. They use it to forecast upcoming price deviations and Long-Legged Doji candlestick pattern is also significant in this sense.
Like the other Doji candlestick patterns, Long-Legged Doji candlestick pattern tells about the equilibrium in the market. The difference is that it tells about the prices that went far higher and at the same time, about the prices that went to extremely low levels. It also shows that supply and demand are in a state of equilibrium and a fall in price may occur at any moment.
How to trade when you see the Long-Legged Doji candlestick pattern?
Once you have a Long-Legged Doji on your chart, it is very difficult to just directly trade off it. The reason is, the range of the candle is so vast and it gets difficult to make a decision. If you trade-off in this situation, your stop loss will also be as vast as the range of the candle.
It is crucial to notice that highs and lows of a Long-Legged Doji candlestick pattern actually become resistant and support on the lower timeframe. So why not trade support and resistance? You may also use level and the areas on your chart to establish a bias to set positions to enter the market.
So, in that case, the market came up higher into the domain of resistance, which means the highs of the Long-Legged Doji. This illustrates the rejection of lower prices. On the other hand, if the prices move below the pattern, it is wise to enter a short position. However, it is highly recommended that other factors should also be considered such as your trading strategy, risk management, etc.