
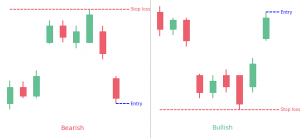
- An Island Reversal Pattern appears when two different gaps create an isolated cluster of price.
- It usually gives traders a reversal biais.
What is the Island Reversal candlestick pattern?
The Island Reversal candlestick pattern is a fantastic candlestick pattern that helps traders to predict future market movements. It is formed when a cluster of trading days is isolated by two different gaps in the price action. In simple words, the Island Reversal candlestick pattern consists of groups of bars that are isolated by gaps on either side. The gaps indicate that the Island Reversal means a sharp and sudden change in the direction of the current trend. Although this pattern is not very common yet it has the potential to warrant the attention of the traders.
As the name Island Reversal suggests, it signals a trend reversal that can be both, bullish or bearish. That means its price pattern indicates that prices may reverse irrespective of the current trend in the market. The alignment of the gaps is significant to identify the trend.
A gap down followed by a gap up marks the bullish reversal. A gap up followed by a gap down marks the bearish reversal. The overlapping of those gaps forms an island of price action. This formation of price action island is the reason behind its name “Island Reversal.” An Island Reversal can appear at the bottom or at the top. It is a Bullish Island Reversal when the island is above the gap. On the other hand, below island indicates a bearish Island Reversal.
How to identify the Island Reversal candlestick pattern?
The identification of the Island Reversal candlestick pattern is quite easy. As we have discussed earlier that the Island Reversal patterns can be both, bullish and bearish. It is important to know about the identification of both of the reversal patterns.
Identification of the bullish Island Reversal
It is easy to guess that the bullish Island Reversal pattern appears during a bearish trend to turn it around. The first thing to note is the presence of a downtrend in the market. There must be a negative gap that signals the start of a reversal. After the identification of the gap, it is all about noticing the behavior of the market whether it is continuing downward movement or is it consolidating. The gap zone remains intact and the price should recede after an upward movement. After trading below the gap for some time and the formation of price action, it generates a positive gap. It usually appears at or very close to the price level where the first gap was formed.
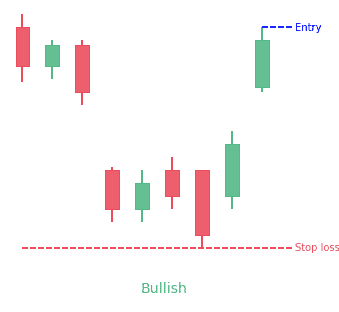
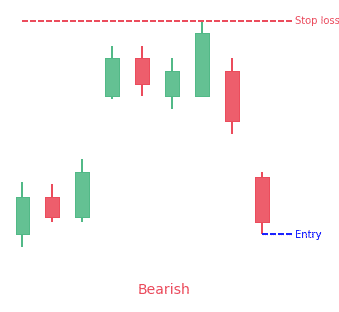
Identification of the bearish Island Reversal
Again it is quite easy to predict that a bearish pattern appears during a bullish trend. For a bearish Island Reversal, the market should be in an uptrend and there should be a significant positive gap. It is important to notice whether the market is continuing upward movement or is it consolidating without filling the gap. It is crucial that the gap zone doesn’t fill immediately. This will give rise to a bearish trend occurring around the first gap.
So, as a general rule, the Island Reversal candlestick pattern usually comes into existence after the movement of the market in a certain direction followed by the formation of a gap in the direction of the movement. The gap will be upwards during the upwards movement and it will be downwards during the downwards movement of the market. This advancement will be for a short interval and the formation of a gap in the opposite direction will be imminent.
Important features of the Island Reversal candlestick pattern
- The occurrence of the Island Reversal pattern is very rare
- An Island Reversal can appear at the bottom or at the top
- Its gap form at almost the same level of price
- It is well known for a really good indication of a primary or intermediate trend reversal
- Its appearance indicates an extreme change in the sentiment among the traders
How to trade when you see the Island Reversal candlestick pattern?
Island Reversal is a nice reversal pattern
The Island Reversal candlestick pattern indicates an imminent movement in the opposite direction of an existing movement. Traders can exploited it with their trades. However, it must be remembered that it is a short-term candlestick pattern that requires wit to use it. It is also important to notice that the Island reversals are very rare in the forex trading market.
They may occur sometimes and they will require an immediate response to take full advantage. Let us suppose that if a trader identifies an Island Reversal at the top, a selling response will be most evident. Similarly, if an Island Reversal is spotted at the bottom, it will demand a buying action. However, the technical analysts and expert traders suggest that the Island Reversal candlestick pattern should not be used in isolation. Several expert technical analysts and authors have illustrated that they found this candlestick pattern unreliable because of infrequent occurrences and poor performance results.
Few trading tips
There are certain tips traders can apply to increase the usability of the Island Reversal candlestick pattern.
- You can get some hints about the usefulness of the pattern by observing the volume of the market. You need to observe whether the volume is increasing or decreasing. An increase in volume is a signal of an upcoming trend reversal. Technical analysts, in fact, give more weight to the reversal signal that is formed under the increasing volume of the market.
- The size of the gap is also important to assess the usefulness of the Island Reversal pattern. The bigger last gap than the first gap is given more importance by the technical experts.
- The length of the Island is another aspect that traders must account for when using the Island Reversal candlestick pattern. There is a strong possibility that a lengthy Islands may go undetected by the traders. Therefore, it is best to ignore the island for longer than 3 months.