
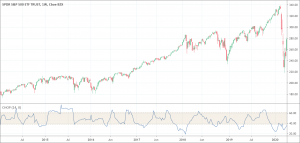
- The Choppiness Index indicator is a volatility indicator.
- It determines whether the market is following a trend or the market is choppy and trading sideways.
The Choppiness Index indicator is a volatility indicator that determines whether the market is following a trend or the market is choppy and trading sideways. It determines only the choppiness of the market and does not predict future prices. The Choppiness Index helps to confirm the prevailing market conditions. The indicator has two parameters to measure the choppiness. The Choppiness Index value remains between 0 and 100. When the Choppiness Index indicator calculated values are closer to 100, the market is choppy. Conversely, when the values are near zero, the market is in a directional trend.
The Choppiness Index indicator does not exhibit a direction. It is in fact a directionless indicator. High readings of the CHOP indicator are because of significant consolidation in the action of the price. A possible end of a strong impulsive movement is indicated when the CHOP values are low. The Choppiness Index was introduced by Australian commodity trader Bill Driess.
The Choppiness Index formula
Choppiness Index = 100 × Log10 {Sum (True Range, n)} / [{Maximum (True High,n)} – {Minimum (True Low,n)}] / Log10,n
The basic principles of the Choppiness Index’s working
- The CHOP indicator is a range-bound indicator that gives calculations that fall between the range of 0-100.
- Calculated values near 100 indicate the choppiness of the market.
- Calculated values near 0 show the directional movement or trendiness of the market.
- There are two thresholds that come with default parameters, 61.8 and 38.2. Technical analysts consider the market choppy when the CHOP values are above 61.8 thresholds. Conversely, they consider the market trending when values are below zero.
What does the Choppiness Index indicator tell traders?
As we have discussed in detail that the Choppiness Index is an indicator that tells about the market conditions. It confirms market conditions with calculated values ranging between 0 to 100. Values close to 100 indicate choppiness and values bear 0 show the market trending. Traders can also employ the CHOP indicator to anticipate upcoming changes in the trendiness of the market. As a general rule, extended periods of consolidation or sideways trading usually gets followed by an extended period of trending.
How to use the Choppiness Index indicator?
Technical analysts and traders use the Choppiness Index indicator to assess and confirm the current market conditions in the following ways.
- When the CHOP values are above 61.8 thresholds, it means consolidated market or sideways movements in the market.
- When the CHOP values are below 38.2 thresholds, it indicates a continuing trend.
- If the consolidation remains for an extended period of time, it means that a period of trending would follow soon. Similarly, when the trending period lasts long, it suggests that a period of consolidation would follow soon.
Conclusion
The Choppiness Index indicator is an interesting tool that helps to identify ranges of trends. It works on simple rules and its use is also straightforward. However, it is difficult to identify when a trend would stay or when it would reverse. Therefore, it is always advised to use the CHOP indicator with other technical analysis tools that may significantly increase the odds of successful trading.