
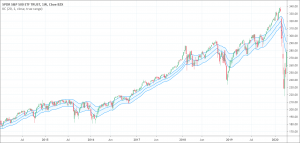
- The Keltner Channel is a volatility based indicator.
- It indicates whether the market’s trend is likely to continue or it may change direction.
- It is generally built with a 20-period EMA as the center line and two lines above at a 2 Average True Range distance.
The Keltner Channel is a volatility based indicator that indicates whether the market’s trend is likely to continue or it may change direction. The Keltner Channel indicator observes price movements in relation to the band forms by lower and upper moving averages. The direction of the Keltner Channel shows the prevailing market trend but it is fundamentally a price reversal indicator.
The Keltner Channel is a band and envelope based indicator just like Bollinger Band or Moving Average Envelope. It plots lower, upper, and middle lines through volatility and average prices. All of these lines move in accordance with the price and create an appearance resembling a channel. The middle line exhibits a moving average over a predefined period of time. The upper envelope is formed above the middle line while the lower envelope remains below the middle line. When the price goes above the upper band, the market conditions are overbought. The market is oversold when the prices move below the lower band.
Chester Keltner presented the basic idea behind the Keltner Channel in his book How to Make Money in Commodities in 1960. Afterward, his ideas have been continuously expanded as well as simplified by certain other experts. One of such innovators is Linda Bradford Raschke who prominently modified the Keltner Channel. She introduced an exponential moving average for the middle line and moving true range replaced the envelopes.
Calculations of the Keltner Channel
The calculations of the Keltner Channel are very simple as compared to other indicators. An exponential moving average and average true range computes for a predefined period of time, typically for 20 periods. The upper band value is now calculated by multiplying average true range to 2 and then adding to the exponential moving average. The lower band is calculated next by again multiplying to 2 and then adding to the exponential moving average. These steps repeat after each period of time to calculate the Keltner Channel for each period. The formula of the Keltner Channel is as follows.
The Keltner Channel Middle Line = Exponential Moving Average
Upper Band = Exponential Moving Average + (2 × Average True Range)
Lower Band = Exponential Moving Average – (2 × Average True Range)
What does the Keltner Channel tell traders?
It is interesting to note that channels, bands, and envelope based indicators are developed to encompass most price actions. That is the reason that movements above or below the channel lines demand the attention of the traders because of the rarity of those movements. The movements above the channel lines indicate the strength of a bullish trend in the market. On the other hand, the movements below the channel lines show the strength of a bearish trend. Such movements tell the traders about the end of one trend and the beginning of the other.
Moreover, the Keltner Channel indicator becomes a trend following indicator when its functioning is based on the exponential moving average. Through the direction of the moving average, it also conveys something. When the channel moves above, it is an indication of an uptrend. Conversely, when the channel moves below, it is an indication of a downtrend. When the channel moves sideways, it means the trend is flat and neither uptrend nor the downtrend has the significant strength to overpower the market. If the price goes above or below the channel during a flat trend and the channel direction also follows the price movement, it indicates that a new trend is going to appear on the horizon in the breakout direction.
How to use the Keltner Channel indicator?
The Keltner Channel helps to set the entry and exit points for the trade. It also provides clues for an upcoming change in the trend. It also helps to spot oversold and overbought market conditions. There are different strategies traders can employ to increase the odds of gains.
The trend pullback strategy
The trend pullback strategy is a general and most common buying strategy during an uptrend when the price pulls back to the middle line. Placing a stop-loss halfway between the lower and middle band along with setting target prices near the upper band is always a wise move. Traders may move their stop-loss more closer to the lower band if the price begins to hit stop-loss a lot. This improvisation widens the room for the trade and reduces the number of unsuccessful trades.
Now, if the price goes to the middle line during a downtrend, traders should seek to sell short. Now traders can place the stop-loss halfway between the upper and middle band along with the setting of the target near the lower band. If the prices begin to hit the stop-loss very often, traders can readjust the stop-loss and this time move it closer to the upper band.
The breakout strategy
The breakout strategy focuses on big moves and is usable near a market open. It is common to buy if the price moves above the upper band and to sell when the prices go below the lower band. The middle band acts as an exit point in the Keltner Channel breakout trading strategy. However, it is extremely important to note that one signal with the potential of profit or loss is followed by a second signal. Traders should look for this second signal as well. If the big price movement does not occur as a result of the first two breakouts, then there are strong chances that it won’t happen. This strategy is highly advantageous for the assets which often have sharp trending movements.
Overbought and oversold market conditions
Overbought and oversold market conditions are also important notions when using the Keltner Channel indicator. When the prices go above the upper line but then fall back to close inside the upper line, it is overbought market condition. It indicates that a tumble is possible because the price doesn’t have the momentum to sustain the upward surge. This indication signals to seek place short sale orders. Conversely, when the prices move below the lower line but rise again to close inside the channel, it is oversold market condition. It indicates that bearish pressure doesn’t have the strength to sustain itself. It is an indication to place buy orders in the market.
The limitations of the Keltner Channel indicator
Just like the other technical analysis tools, the Keltner Channel indicator has also certain limitations. For example, the Keltner Channel cannot give indications or can predict future prices. It also relies on the historical data that makes it a lagging indicator as well. Therefore, the experts suggest to use the Keltner Channel in conjunction with other indicators to better confirm its findings.s
Conclusion
The Keltner Channel effectively identify and determine the overbought and oversold market conditions. It is the banded indicator that does so in its own unique way. It has also potential to indicate to tell traders whether the prevailing trend might continue, accelerate, or reverse. The effectiveness of the Keltner Channel indicator relies heavily on its use of exponential moving average sandwiched between the true range. Moreover, traders can configure the indicator for different time periods to suit the trading strategy. Even though the Keltner Channel is usable as a standalone indicator but it is better to use it in combination with other technical analysis tools because of certain limitations that the Keltner Channel has.