
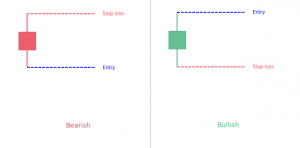
- The Short Line candlestick pattern is a 1-bar very simple to understand pattern.
- It simply consists in a candle with a short body.
- There are various kind of specific variations of the short line pattern (doji, hammer, hanging man, shooting star).
Let’s go in-depth about what the short line candlestick pattern is.
What is a short line candle?
Candlesticks provide different visual hints on the trading charts for a better and easy understanding of the price action. The candlestick chart patterns are a great add to traditional chart patterns because of their functionality and reliability. A candle consists of a body and upper or lower shadow or a wick. Candles can either be bullish or bearish. A bullish candle is formed when the price closes higher than it opened and it has a white color. When the price closes lower than its opening level, it is a bearish candle with black color. Moreover, a candle is short when the market volatility is low and it will be a long line when the volatility will be high.
What is a short line candlestick pattern?
The short line candles have a short real body and an upper and lower shadow (The upper and lower shadow, that represent the high and low of a trading session, is not important in a short line candlestick pattern). It appears when there is a slight difference between the opening prices and closing prices of financial assets during a trading session. A short line may have a wide range of highs and lows but the open and close range will always be a narrow one.
What does the short line candlestick pattern tell traders?
Candlestick charts serve technical analysts and traders in multiple ways. They are fantastic visual guides to assess positive or negative market sentiment at a glance. Similarly, the short line candle is also extremely helpful. Generally, short lines indicate market consolidation with little or no movements in prices during a given period of time. However, short line candles may have different meanings depending on their position on the price charts. For example, a short line candle with a lower tail and without upper wick represents a bullish reversal pattern. It blows the whistle of an upcoming reversal of the trend in the market. On the other hand, short line candles forming a series suggest:
- indecisiveness of the traders
- low volatility in the market
- and also provide traders with clues about the direction of the future prices.
What are the most popular short line candlestick patterns?
The following are some of the most popular short line candlestick patterns.
- A hammer is a short line pattern that appears when the financial assets trade significantly lower than the opening prices. The candle of a hammer pattern has a short body. It has a lower shadow at least twice the size of the real body.
- A hanging man is also a short line pattern that signals a possible bottom is near. It occurs when prices move upward and warn of upcoming lower prices. The candle of the hanging man pattern has a small real body, a long lower shadow, and a little or no upper wick.
- A shooting star is a short line pattern that has a small real body with a long upper wick and a little or no lower shadow. The shooting star appears during an uptrend and signals a potential reversal.
- A Doji is another type of short line candlestick pattern having a small real body with both, upper and lower wicks. It signals the continuation of the trend or a reversal depending on the confirmation.