
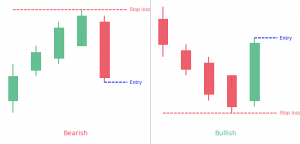
- The modified Hikkake candlestick pattern is the more specific and upgraded version of the basic Hikkake pattern.
- The difference with the normal pattern is that the “context bar” is used prior to the inside price bar.
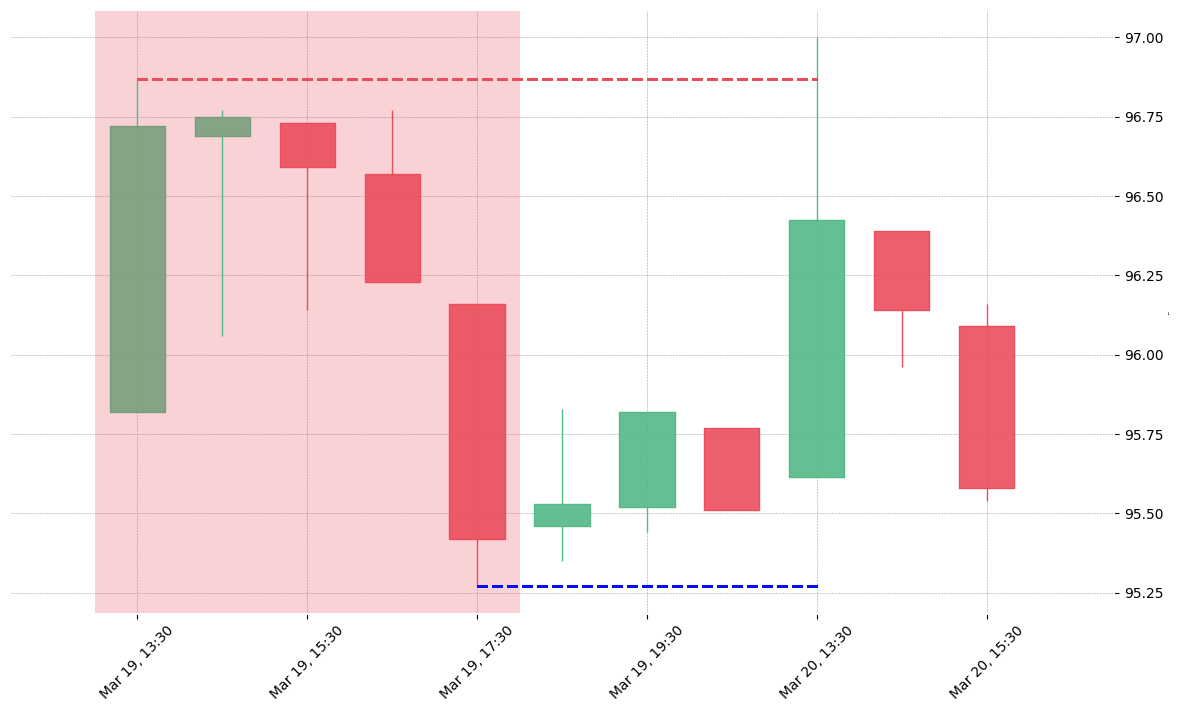
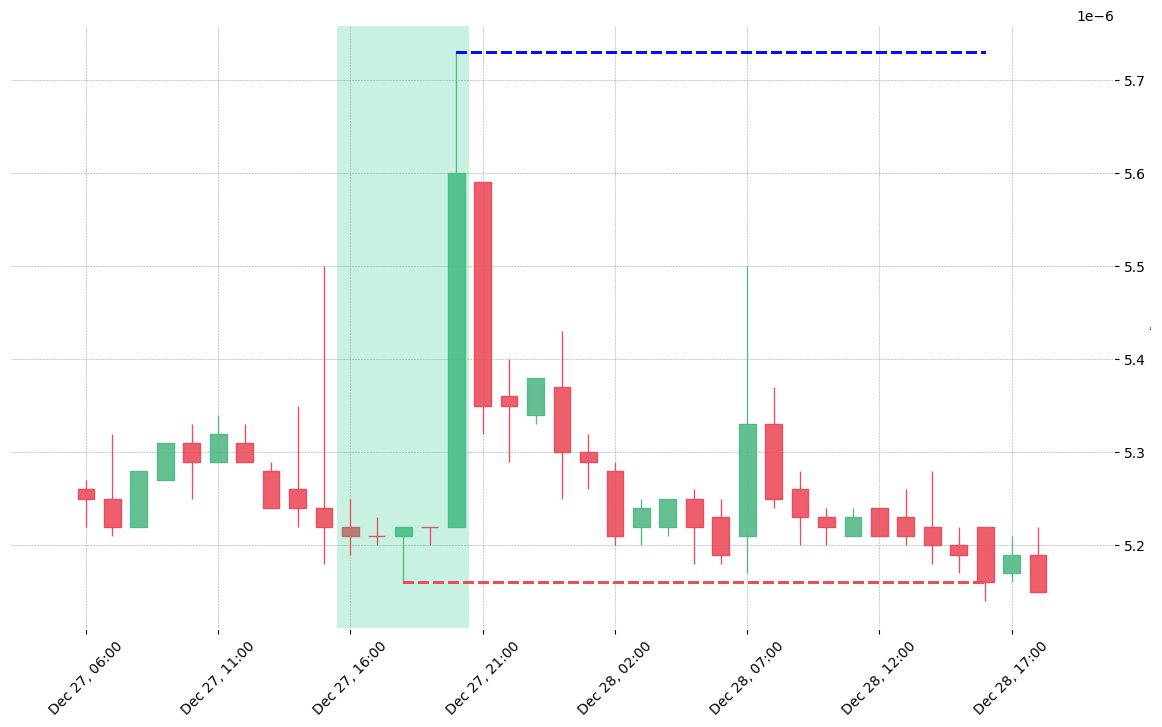
- It consists of a context bar, an inside bar, a fake move, followed by a move above or below the inside bar.
Statistics to prove if the Modified Hikkake pattern really works
Are the odds of the Modified Hikkake pattern in your favor?
How does the Modified Hikkake behave with a 2:1 target R/R ratio?
From our research the Modified Hikkake pattern confirms 58% of the time on average overall all the 4120 markets we analysed. Historically, this patterns confirmed within 4.6 candles or got invalidated within 5.6 candles. If confirmed, it reached the 2:1 R/R target 38.1% of the time and it retested it's entry price level 96.2% of the time.
Not accounting for fees, it has an expected outcome of 0.143 $/$.
It means for every $100 you risk on a trade with the Modified Hikkake pattern you make $14.3 on average.
Want to account for your trading fees? Have the detailled stats for your favorite markets / timeframes? Or get the stats for another R/R than 2:1?
🚀 Join us now and get fine-tuned stats you care about!
How to handle risk with the Modified Hikkake pattern?
We analysed 4120 markets for the last 59 years and we found 15 924 occurrences of the Modified Hikkake pattern.
On average markets printed 1 Modified Hikkake pattern every 980 candles.
For 2:1 R/R trades, the longest winning streak observed was 10 and the longest losing streak was 18. A trading strategy relying solely on this pattern is not advised. Anyway, make sure to use proper risk management.
Keep in mind all these informations are for educational purposes only and are NOT financial advice.
If you want to learn more and deep dive into candlestick patterns performance statistics, I strongly recommend you follow the best available course about it. Joe Marwood (who's a famous trader with more than 45 000 Twitter followers) created an online course called "Candlestick Analysis For Professional Traders" in his Marwood Research University. There he will take you through the extensive backtesting of the 26 main candlestick patterns. He then summarizes which one is THE best pattern. Do you know which one it is?
Remember, don't trade if you don't know your stats. Click here to signup to the course now!
PS: Save 20% with the SAVE20 code.
What is the Modified Hikkake candlestick pattern?
The modified Hikkake candlestick pattern is the more specific and upgraded version of the basic Hikkake pattern. The Hikkake pattern is a situation that comes during the process of technical analysis. The basic Hikkake pattern indicates a reversal or continuation of the trend. It has two bars, an inside bar and the next day’s follow up bar. On the other hand, the modified Hikkake candlestick pattern uses three bars. A context bar is the third bar of the modified Hikkake pattern. The modified Hikkake is also a limited one that only tells traders about reversals but stays silent about the continuation of the trend.
How does the modified Hikkake candlestick pattern work?
“Hikkake” is a verb in the Japanese language that means to trap or trick. Basically, the modified Hikkake candlestick works on taking profit from the failures of the inside bar breakouts. That means it helps traders to identify the inside bar breakouts. It offer traders an entry point with lower risks for the price action traders.
How to identify the modified Hikkake candlestick pattern?
The modified Hikkake candlestick pattern looks at the context bar before the inside bar. The positioning of the bars tells traders whether it is a bullish modified Hikkake or bearish modified Hikkake. For a bullish modified Hikkake to form, the context bar should close near the bottom of its range. It also should have a smaller range in comparison to the preceding bar. A bullish
pattern here makes sense only if there is a bearish trend that traders want to reverse. That is the reason that the context bar should close near the top of its range and it will be the start of a bullish modified Hikkake.
On the other hand, for a bearish modified Hikkake to form, the context bar should close near the top of its range. It also should have a smaller range in comparison to the preceding bar. The bearish trend here makes sense only if there is a bullish trend that traders want to reverse. Therefore, the context bar should close near the bottom of its range that will be the start of the bearish modified Hikkake.
What does the pattern tell traders?
The modified Hikkake pattern tells traders about the upcoming reversal of the prevailing trend in the market. Moreover, it also allows traders to devise different trading strategies to maximize their profits such as placing a buy or sell, a short entry, stop-loss, etc. The higher high and higher low of the next price bars after the inside bar suggest to place a short entry or sell just below the low of the inside day.
Conversely, the lower high and lower low of the next price bar after the inside bar suggest placing a buy order just above the high of the inside day. Short trade triggering by the bearish modified Hikkake pattern suggests placing stop-loss above the high of the modified Hikkake pattern. Long trade triggering by the bullish modified Hikkake candlestick pattern suggests placing a stop-loss below the low of the pattern. However, expert technical analysts advise using the modified Hikkake pattern in conjunction with other technical analysis tools such as technical indicators to maximize the odds of successful trading.
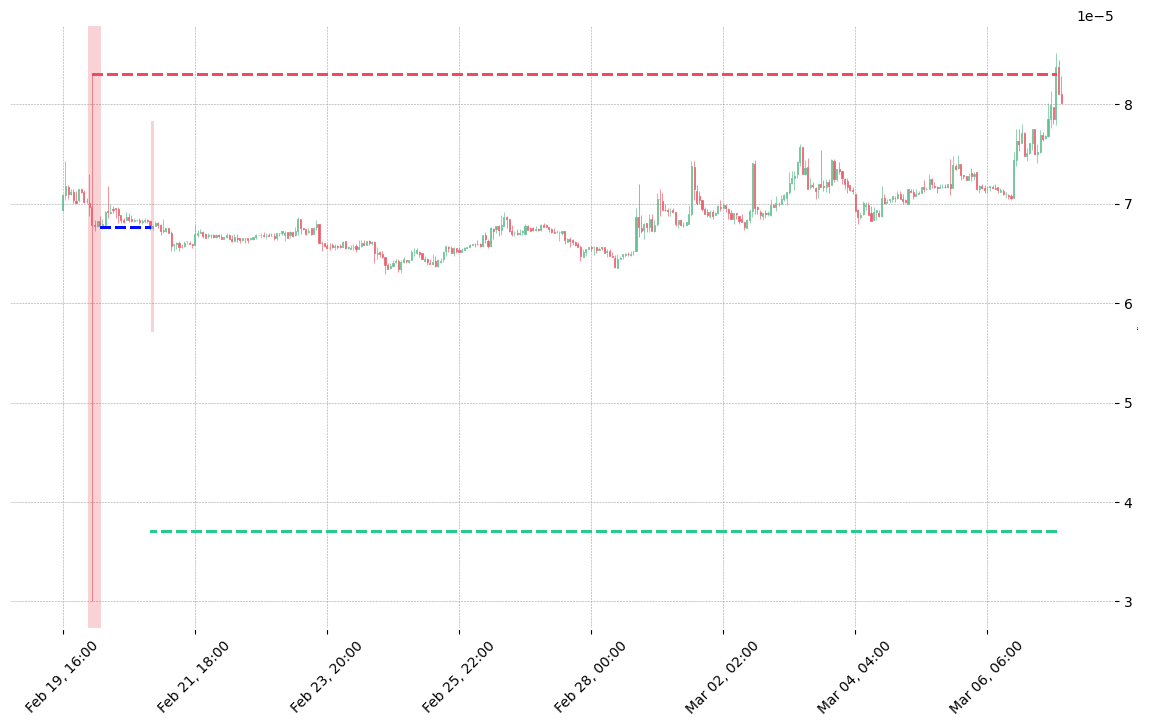
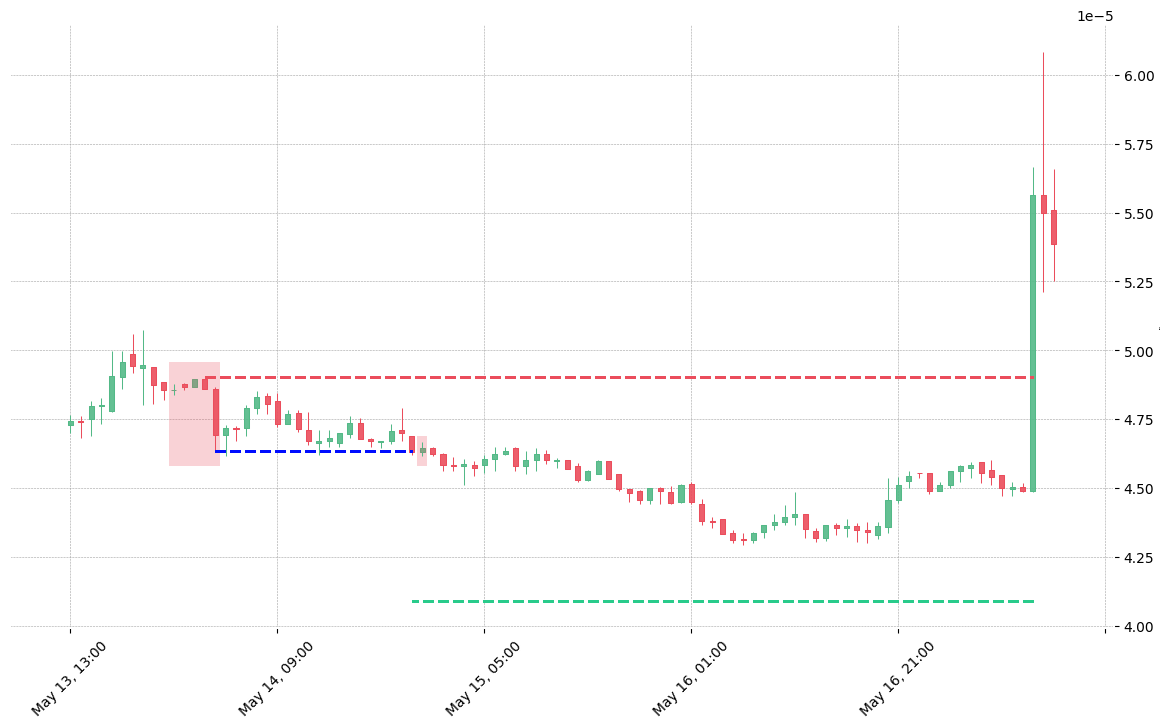
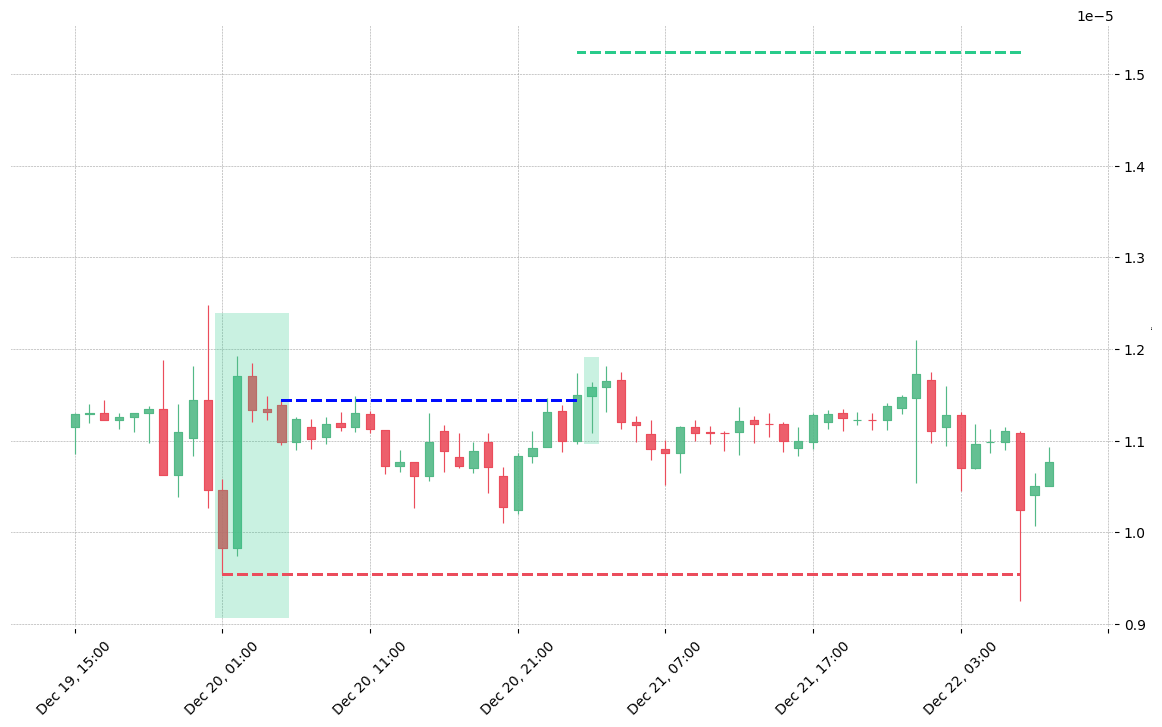
How does the Modified Hikkake pattern look in real life?
Looking to learn more about this pattern?
You should take a look at Joe Marwood's online course. In his course, he backtested the 26 main candlestick patterns before to summarize which one is THE best pattern. I really liked his course and you shouldn't miss it!
Click here to signup to his "Candlestick Analysis For Professional Traders" course now!
PS: Save 20% with the SAVE20 code.