
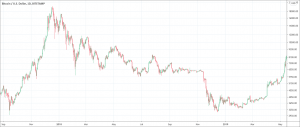
- When talking about Price Action, traders often refer to the up and down movements of a security’s price.
- Price action is what creates technical analysis formation and chart patterns.
- Most indicators also are calculated out of price action.
The price of a financial asset is extremely important for trading because fluctuations in prices ultimately define profit or loss. Price action trading strategy is crucial for traders who wish to base their trading solely on prices. Analysis of the trending waves as part of the price action trading is integral to determine entry and exit points. Therefore, it is highly fruitful for traders to understand the mechanism of the price action and to develop an effective strategy.
What is price action trading?
Price action means the movement of prices over time. The period can be a duration of one minute, one week, or one year. Price action trading, therefore, involves the trading of those price movements or fluctuations in prices over a period of time.
What does the price action trading tell traders?
Price action trading is highly profitable and traders can learn many things by understanding price action and price fluctuations over time, such as.
- The area of interest and involvement of different institutional players
- Where the market is heading under the influence of those institutional participants
- Identification of important support and resistance areas
- Determine almost exact and precise points to enter or exit the market
- Breakouts and reversals
- Tops and bottoms
- Complete information about the trends
- Know about the impulsive and corrective trading moves
- The overall picture of the market such as the market environment
How to analyze the price action?
The analysis of the price action is not much complicated once the basics are well understood. Price action trading is generally about analyzing patterns, waves, trend, and pullback (also known as impulse and corrective waves). A trend in the market continues and progress only when the trending waves are huge as compared to the corrective waves.
Now, how traders can identify the direction of the trend? It is quite simple. Traders can easily identify the direction of the trend by monitoring swing highs and lows or by examining the length of the trending and pullback waves. The following are the simple rules that must be on traders’ fingertips.
- The price movement during an uptrend makes higher swing highs and higher swing lows.
- The price fluctuations during a downtrend make lower swing highs and lower swing lows.
- The area between the support and resistance on a price chart becomes the floating zone of the peaks and troughs of the trendlines.
How to use it?
The price action trading strategy relies on the information acquired through the price action chart. Traders constantly monitor price action charts to get the signals to make a move. Traders should look for the following key pieces of information from the charts.
- Is there a false break or a genuine one?
- Is there a trend in the market?
- Where does the price lies? Is it near or at the level of support and resistance?
- What is the range?
- Any other key signals such as the formation of a key reversal trigger by the price suggesting movements in the market.
Traders may also use price action data to identify the key levels of supply and demand on the charts. They can easily identify when the prices will break out or reverse and hence, can capitalize on this information to maximize the odds of maximizing their profit.
What do the experienced price action traders use for price action trading?
The price action traders constantly look for trigger signals to initiate a trade. To get trigger signals, traders use candlestick patterns at the important areas of the price chart to initiate trading. Pin Bar is among the one example of a price action trigger. However, price action trading means much more than just monitoring the candles or looking for trigger signals. The successful price action traders exploit the whole chart to make prudent and timely decisions. Price tells a lot and learning how to use that information is the key to success. The price action traders may follow the following simple strategies.
- Trend trading: trend trading involves taking trades in the direction of a trend and it is the best way to increase chances of placing winning trades. There are multiple ways to identify trends and trend changes but price action trading is more than enough for the sake.
- Support and resistance levels: price action trading has also the potential to identify the support and resistance and to maximize the gains on trades.
- Supply and demand: price action traders also monitor supply and demand to initiate a trading move.
Moreover, a price action strategy involves the following two steps.
- Identify a scenario to enter a trade such as identification of a stock price entering into a bullish or bearish phase, breakouts, support or resistance, etc.
- Identify the trading opportunities within that scenario and enter a trade.
Conclusion
Price action means the fluctuations in the price of a security over time and price action trading involves trading on the basis of price action. It actually is a data source and provides the foundation for every technical analysis tool. It is extremely beneficial for traders once fully grasped and understood the idea behind the price action strategy. However, it is important to note that trading predictions are always speculative. The more tools traders can use, should use for confirmation.