
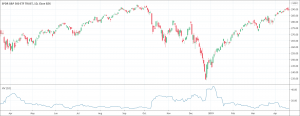
- Historical Volatility is a measure of movements of prices over a specified period of time.
- It deals with measuring the level of price fluctuations of stock prices from its average price over a specified period of time.
- It helps trader quantify how volatile a stock is and how likely it is to show extreme moves.
Volatility is a measure of movements of prices over a specified period of time. In a stock’s analysis, there are two main types of volatility, historical volatility, and implied volatility. Implied volatility is projected volatility and is simply an estimate of the future volatility of a security or stock. On the other hand, it refers to, as the term suggests, the historical data regarding stock price fluctuations.
What is historical volatility?
Historical volatility is a concept in technical analysis. It deals with measuring the level of price fluctuations of stock prices from its average price over a specified period of time. The more prices deviate, the more will be historical volatility. It is important to note that it only refers to how volatile the prices have been. It does not indicate the direction of price movements. There are multiple reasons to think about the historical volatility of security but generally, it is a risk measure. It tells us how volatile the particular security has been. As we know that high volatility means high risk and vice versa.
Why is it important?
Historical volatility is a very important measure. Its calculations are easy and simple because we have all the historical data. We can use the variability of prices to get to value. The change from one closing price to the next is the basis of calculations for historical volatility. It is important because it is a crucial risk measurement. It can help investors to assess the level of risk associated with security. Volatility is also helpful for comparison purposes where traders can compare different stocks and choose the stock for trading according to their own trading strategy.
Historical volatility also gives another very important indication. When the volatility of a stock is rapidly rising, it indicates that the market expects something to change or something associated with that stock has already changed. Moreover, stocks with high historical volatility are not necessarily bad stocks to trade, it is just a matter of high risks. High risks may yield high rewards as well. And the investors dealing with stocks with higher volatility have a high tolerance of risk
What historical volatility can offer to traders?
As we have already discussed that high volatility doesn’t mean the security is bad for trading. It is just a measure of risk. Traders dealing with stocks having high volatility tolerate higher risks but they have more potential of gaining higher rewards as the maxim states “high risks, high rewards”. However, traders must remain alert and vigilant because securities with high volatility have also a huge loss potential as well. Therefore, it is imperative that volatility levels should be somewhere in the middle. Those middle levels vary from market to market and from stock to stock. The comparison of stocks is crucial to find out the middle or normal levels of volatility in the market.