
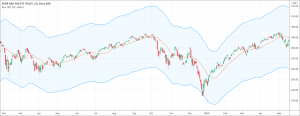
- An envelope refers to two lines plotted above and below a security’s price.
- It is drawn by drawing a Simple Moving Average and 2 SMA around it at a fixed distance.
The Envelope or envelope channel indicator is a technical analysis tool. It helps to spot the upper and lower bands of the trading range. In technical analysis, an envelope refers to trend lines appearing on the trading chart both above and below the current price. A simple moving average and a pre-determined distance above and below the moving average generate the upper and lower bands of an envelope. It spots the upper and lower bands by drawing two moving average envelopes on the trading chart. It lifts up the first moving average envelope a certain distance above and shifts the other moving average envelope a certain distance below.
The prices show the tendency of remaining within a certain range when the market conditions are normal. When the market conditions change, the prices have the potential to move above or below the envelope bands. This is the main idea behind the envelope channel indicator. Traders consider it a selling signal when the prices reach or go beyond the upper band. On the other hand, traders consider it a buying signal when the prices reach or go beyond the lower band. The envelope indicator also helps to spot extremely overbought and oversold market conditions.
The basics of the moving average envelope
Moving average envelope is an indicator that follows the trend. As we know that moving averages always lag behind prices, so will the envelope. That is the reason that prices breaking through any of the envelope bands always get noticed. Moreover, the moving average envelope is designed in such a way that a major part of the price action occurs in the envelope range. Therefore, whenever the prices breakthrough, it indicates the strength and at the same time, it can signal a significant price movement. For example, during a strong uptrend or downtrend, a breakthrough in prices above the upper band indicates the strengthening uptrend and will continue. During a sideways trend, a breakthrough in prices above the upper envelope channel indicates overbought market conditions causing prices to fall back within the range of the envelope.
The Envelope Channel indicator’s calculations
Moving averages help for the envelope band’s calculations. The setting of the bands at a certain distance above and below the price plots the envelopes. The formula for the envelope indicator is the following.
Upper envelope or upper band = (Simple moving average over a period) + (Simple moving average over a period × D^%)
Lower envelope or lower band = (Simple moving average over a period) – (Simple moving average over a period × D%)
*Where D is the deviation value showing the distance between the envelopes and moving averages.
What does the envelope indicator tell traders?
The envelope indicator tells many things to traders and is a useful technical analysis tool. It tells about the overbought/oversold market conditions and generates buying and selling signals. When the prices reach or cross the upper band, it indicates that the market condition of the security is overbought and it signals to sell. On the other hand, when the prices reach or cross the lower band, it suggests oversold market conditions and signals to buy. However, it is absolutely imperative for traders to use higher percentages to create envelope bands when they deal with securities with high volatilities. It helps greatly to avoid whipsaw trading signals. Conversely, lower percentages are enough for the securities with fewer volatilities to create enough trading signals.
The parameters for the moving average envelopes
As is the case with many other indicators, the performance of the moving average envelope indicator depends on choosing the correct parameters. However, it is a matter of experience and experimentation. The parameters for this purpose depend on the trader’s trading goals and the security of the trader’s choice. Traders prefer short moving average with relatively tight envelope bands while investors prefer a longer moving average with wider bands.
The volatility level of the securities also influences the parameters. Traders should always consider the volatility of the securities when setting the envelope bands. The bands will be wider for securities with high volatilities and narrow bands for the securities with low volatilities.
Trend identification
As we all know that moving averages are excellent trend confirmation as well as a trend-following tool. As moving averages are at the heart of the envelope indicator, the indicator reflects these inherent aspects of the moving averages.
- Moving averages allow us to see the broader pattern of the market by smoothing the price fluctuations. A line of moving average sloping upwards indicates prices being trending upwards and vice versa. Similarly, envelope indicator can also help us to confirm the trend. If bands of the envelope indicator are sloping upwards, it confirms an uptrend and vice versa.
- Prices breaking above the upper band signal a potential start of a new uptrend. Conversely, when the prices break below the lower band, it is a signal of a possible new downtrend. However, traders should be alert because all breakthroughs of the prices do not lead to new trends.
Conclusion for the envelope indicator
Moving the average envelope indicator is one of the most effective and useful technical analysis tools despite being very simple. It helps to identify trends and in trend following as well as helps to identify overbought/oversold market conditions. The envelope indicator also has the potential to generate buying and selling signals. When the prices reach or cross the upper band, it indicates that the market condition of the security is overbought and it signals to sell. On the other hand, when the prices reach or cross the lower band, it suggests an oversold market condition and signals buying. Those are the valuable traits for an indicator that can greatly help in trading and technical analysis. The envelope indicator has it all to become an important part of the overall trading strategy when combined with other technical analysis tools such as momentum indicators.