
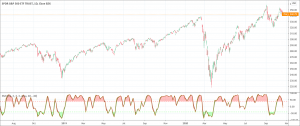
- The Stochastic Momentum Index (SMI) is based in the Stochastic Oscillator.
- The SMI show the distance between the closing price and the center of each candles high/low range.
- It ranges between -100 and 100.
William Blau developed the stochastic momentum index (SMI) indicator in 1993. It is based on the stochastic oscillator and there is a slight difference between the two indicators. The stochastic oscillator uses close relative to the high/low range for its calculations. On the other hand, the SMI indicator uses a close relative to the midpoint of the high/low range. The values of the stochastic momentum index indicator fluctuate between -100 and +100. The SMI is above zero when the close is above the midpoint and the SMI is below zero when the close is below zero.
Stochastic momentum index indicator’s formula
The stochastic momentum index indicator’s formula is a very simple one. The formula is:
cm = close – (highest high + lowest low)/2
hl = highest high – lowest low
cm = EMA {EMA (cm)}
hl = EMA
{EMA (hl)}
SMI = 100 × (cm / hl÷2)
Signal = EMA (SMI)
How to interpret the stochastic momentum index indicator
It is important to know how to interpret the overbought/oversold conditions, signal line crossover, SMI divergence, buying, and selling signals. The SMI indicator signals overbought/oversold market conditions through extreme SMI values. A signal line crossover above indicates a buy signal or when the SMI rises above -50 while a signal line crossover below indicates a selling signal or when the SMI falls below +50. Traders should also keenly observe for divergences with the prices to get signals indicating the end of a trend or a false trend.
How to trade with the stochastic momentum index indicator
Traders may use the following trading techniques to trade with the stochastic momentum index indicator.
Overbought/oversold level crossovers
If traders are not able to clearly identify the support and resistance levels, it is very risky to blindly trade overbought/oversold conditions. Moreover, trading against a well-defined trend is a tough game to play. Therefore, it is necessary to take precautions, be patient, and trade with great care. The popular overbought/oversold levels at the SMI indicator are +/- 40.
Signal line crossover
The stochastic momentum index indicator’s signal line crossovers present many trading opportunities with smaller win percentages. It is crucial, therefore, to filter out lower probability crossovers. A simple method for such filtration is to add a neutral zone to the indicator at the levels of +/- 15. For example, you are about to enter a trade after the SMI crossover at -40 or less and you notice a +/- 15 neutral zone crossover, you should not reverse your position and wait for the market’s reaction to relative support on the current higher movement. Now, if you observe that the market successfully moves through the neutral zone while the trend is still intact, you can now tighten your stops or even you can add to your trade if you want.
SMI divergences
Divergence isn’t a very common signal when using the SMI indicator and that is the reason that it may be a very effective signal when it gets appeared. Divergence happens when the prices make higher highs but the SMI doesn’t. It happens on the buy-side of the chart. Similarly, on the sell side of the chart, divergence happens when the prices make lower lows but the SMI doesn’t. It gives an opposing buy signal as prices break relative resistance.