
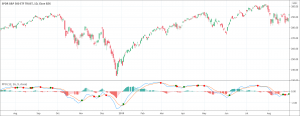
- The Percentage Price Oscillator is based off 2 moving averages.
- It is very similar to the MACD indicator.
The Percentage Price Oscillator (PPO) is a technical analysis tool that measures the relationship between the two moving averages in terms of percentage. These two moving averages are 26-period and 12-period exponential moving average (EMA). The PPO indicator value shows the difference between those two moving averages as a percentage of the 26-period EMA.
The Percentage Price Oscillator’s formula
The formula of the Percentage Price Oscillator is:
Percentage Price Oscillator = (12-period EMA – 26-period EMA) / 26-period EMA × 100
How does the Percentage Price Oscillator work?
The Percentage Price Oscillator works on the basis of its calculations. It gives the PPO values by applying the above formula. The PPO indicator generates the signal line by calculating the 9-period EMA of the PPO once it has at least nine PPO values. The PPO indicator has also the option of a Histogram. It produces the Histogram readings by subtracting the recent PPO value from the current signal line value.
How to interpret the Percentage Price Oscillator?
The interpretation of the Percentage Price Oscillator is very similar to the Moving Average Convergence Divergence (MACD) indicator. There is only a slight difference. The MCAD gives the absolute difference while the PPO indicator gives a relative value because it is normalized. This normalization makes the comparison of different securities with the PPO possible even when there exists a huge difference between the prices.
The stock price is bullish when the PPO crosses above the signal line. Similarly, the stock price is bearish when the PPO crosses below the signal line. The Histogram helps greatly in the anticipation of the PPO / signal line crossovers.
The PPO movement from below to above the centerline indicates bullish momentum. On the other hand, the PPO movement from above to below the centerline suggests bearish momentum. The PPO indicator also helps traders to look for divergence between the price and the oscillator. When the price is making higher highs but the PPO makes a lower high, it indicates the upward momentum is fading. Conversely, when the price is making lower lows but the PPO makes a higher low, it indicates the downward momentum is fading and prices will soon rise.
How to trade with the PPO indicator?
The Percentage Price Oscillator is a very useful momentum indicator that helps greatly in trading. The PPO issues a buy signal when the PPO line goes above the signal line from below. It is a buy signal because PPO above zero confirms an uptrend since the longer-term moving average is lower than the short-term moving average.
Conversely, it issues a well signal when the PPO line goes below the signal line from above. It is a sell signal because PPO below zero confirms a downtrend since the longer-term moving average is higher than the short-term moving average. Some traders prefer only to act on buy signals when the PPO is above zero or when the price shows an overall uptrend. They ignore buy signals when the PPO is below zero or only they act on short-sell signals.