
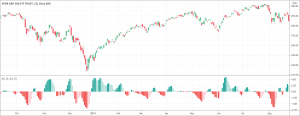
- The Accelerator Oscillator helps gauge the momentum in the market.
- It helps predict when the momentum will change.
- The Accelerator Oscillator measures the acceleration or deceleration of the current driving force in the market.
The Accelerator Oscillator (AC indicator) is a technical analysis tool that helps to gauge the momentum in the market. It also helps to predict when the momentum will change. AC indicator is a very significant indicator. Momentum is one of the most important factors in forex trading and technical analysis. The fading momentum during a downtrend indicates less interest in the financial asset. This information leads traders to profit-taking and even selling trading strategies. Conversely, the fading momentum during a downtrend suggests that buyers have entered the market and traders can go for short covering.
Bill Williams first invented the Accelerator Oscillator to measure the acceleration or deceleration of the current driving force in the market. He developed it as a component of his Awesome Oscillator. The AC indicator is based on a very simple assumption. It is that the momentum falls before the market prices change their direction. Thus, the AC indicator issues signal by slightly changing its direction before the change in momentum.
How to calculate the Accelerator Oscillator?
The calculations of the Accelerator Oscillator has three major steps.
- Calculations of the Awesome Oscillator that is the difference between the two moving averages, the fast-moving average, and the slow-moving average
Awesome Oscillator = Fast moving average – slow moving average
- Calculation of another 5-period simple moving average.
- Finally, calculate the AC indicator by using the following formula:
Accelerator Oscillator = Awesome Oscillator – 5-period moving average
How to interpret the Accelerator Oscillator?
Accelerator Oscillator’s interpretation is simple and very easy to understand. The AC indicator has two lines and those two lines show the acceleration or deceleration of the current driving force in the market. The values of the AC indicator higher than the zero line indicate that the uptrend will continue in the market. Conversely, the values below the zero line suggest that the downtrend will continue in the market.
The Accelerator Oscillator gives a buy signal by printing two green bars one after another while the AC indicator is above the zero line. Conversely, when the AC indicator prints two red bars conservatively while the indicator is below the zero line, it is a sell signal.
How to trade with the indicator?
It is important to observe the value as well as the color of the AC indicator’s bars to effectively trade with the Accelerator Oscillator. As a simple guideline, traders should not buy when they see a red bar and they should not sell either if they see a green bar. Thus, the Accelerator Oscillator also helps traders to eliminate bad entries.
Traders should buy when the traders see at least two consecutive green bars above zero. The momentum is against the trade when traders seek to buy while the AC indicator is below zero. Moreover, a long position entry when the AC values are negative requires an extra confirmation of three consecutive green bars. The same is the case for selling as well as a short position. Traders should sell only when the Accelerator Oscillator forms at least two consecutive red bars. When the red bars appear above the zero line, traders need at least three consecutive red bars.