
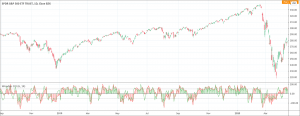
- The Woodies CCI indicator is designed to help traders identify turning points.
- It is a complete system with predefined rules.
The Woodies CCI indicator is a technical analysis tools popular for generating strong signals for trading binary or digital options and CFDs. It is quite a complex trading system rather than just being an indicator. However, it is very easy to use and that is the reason that the Woodies CCI well appreciated for it by the traders and technical analysts. Traders using the indicator do not need to work hard to look for complicated graphic patterns. They do not even need to laboriously observe to predict the direction of the prices. Traders just need to follow the rules of the Woodies CCI and that is enough.
Trading against the market trends is tough and a very risky game while using the Woodies CCI indicator. Traders should follow the trends for better chances of successful and profitable trading. However, if traders want to take risk by trading against the trend, they certainly need significant experience of trading with the trend.
How does the Woodies CCI indicator work?
Ken Wood developed the Woodies CCI indicator and it can be used as a standealone indicator for trading because it is a complete package. Being a complete package or being a trading system means the indicator incorporates other indicators and metrics effectively. There are 5 basic elements of the Woodies CCI:
- The (main) CCI
- The CCI Turbo
- The CCI Histogram
- The base line
- Support and resistance line
The CCI and the CCI turbo are two indicators with different time periods. The CCI has generally 14-period setting while the CCI turbo has a shorter period, generally 6-periods. A red line represents the CCI while a green line represents the CCI turbo.
The CCI is the most important element of the Woodies CCI indicator. CCI stands for Commodity Channel Index. As you already know that the Commodity Channel Index is an oscillator that gives the difference between the price change of an asset and its average price. When the CCI indicator is up, prices of the assets are well above the average and vice versa.
The Histogram remains above the zero line when trend is positive. It remains below zero when the trend is negative. The previous performance of the CCI determines the colors of the Histogram bars. When the Woodies CCI indicator remains above the zero line for six bars or longer, the next bar gets green. When the indicator remains below the zero line for six bars or longer, the next bar gets red. The base line is at zero. The fifth element is the support and resistance line. It is set at +/- 100 by default or it can adjusted.
How to use the Woodies CCI indicator for trading?
The Woodies CCI indicator generates the following types of signals.
Zero-line reject
During a strong trend, when the CCI bounces off in an opposite direction after getting close to the zero-line, it is signal of trend reversal. Traders should make an entry based on the existing trend direction.
Reverse divergence
Whenever there are peaks and troughs on the CCI making a straight line when connected and the straight line also points to zero, it is signal of a strong trend in the direction of the straight line.
Horizontal trend line break
When the CCI forms two peaks or troughs exactly on the same level around +/- 100, traders should consider a new deal. This signal of the Woodies CCI indicator is a tricky one because it can be in both directions, prevailing trend and against it.
Although this indicator incorporates many signals, relying fully indicator can be very dangerous for traders.