
- The Trend intensity index (TII) indicator measures the strength of a trend in the market.
- It compares the price of the last 30 days to the 60-day moving average.
M.H. Pee developed the Trend intensity index (TII) indicator to measure the strength of a trend in the market. It uses the current 60-day moving average for the measurements. TII looks at the proportion of prices of prior 30 days being above or below today’s 60-day moving average. The purpose of the TII indicator’s measurements is to gauge the future price trend movement.
The calculations and the formula of the trend intensity index indicator
The TII indicator takes today’s 60-day moving average and each day’s deviation (close – average). Up deviations give a positive amount while the downside deviations give negative amounts.
Up = close – average
Down = average- close
Now, the trend intensity index is the percentage of the total up amount out of the total up and down amounts. The formula is:
Trend intensity index (TII) = {total up / (total up + total down)} × 100
How to interpret the trend intensity index indicator
The trend intensity index indicator ranges between two values 0 and 100. The value beyond 50 indicates a bullish trend while the TII indicator’s values below 50 indicate a bearish trend. The distance from the 50 points is also a measure of the trend’s strength. The TII values near 80 mean a strong bullish trend while the values near 20 suggest a strong bearish trend.
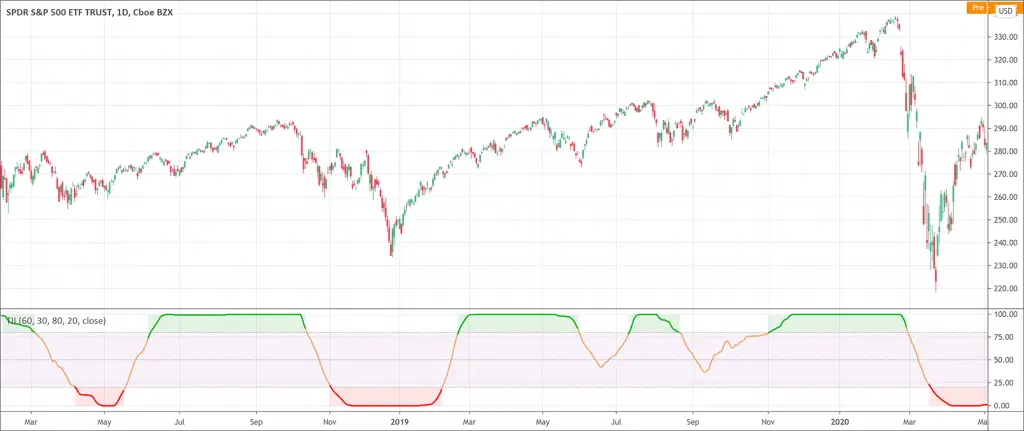
How to use the TII indicator for trading?
As we have already discussed that the TII indicator indicates the strength of the current trend in the market. The market is more likely to continue in the current direction when the TII indicator indicates a strong current trend. Traders can enter the market when the current trend is very strong and they should continue until the TII shows signs of a potential reversal of the current trend. Once the TII indicates a potential reversal, traders should leave their position and should get ready to initiate the trade in the opposite direction.
The TII buy strategy involves the following steps.
- The signal line crossing from above the TII line.
- The price is above the SMA 50 while the TII value is near 20.
- Place stop-loss near swing low.
- Take profit may also be the same size as a stop-loss.
The TII sell strategy involves the following steps.
- The signal line crossing from below the TII line.
- The price is below the SMA 50 while the TII value is near 80.
- Place stop-loss near swing high.
- Take profit may also be the same size as a stop-loss.
Moreover, if traders want to enter a long position in the next trading session, the TII should be above 80. Conversely, if traders want to enter a short position in the next trading session, the TII needs to be below the 20 points mark. However, the trend intensity index indicator is a quite simple indicator and it is always recommended to use it in conjunction with any other technical analysis tools. It will always be a fruitful strategy to enter the trade when the signals of each indicator confirm each other.