
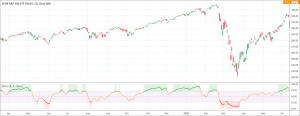
- Relative Momentum Index (RMI) indicator tries to improve the reading of the RSI indicator.
- It calculates a ratio of upwards changes to downwards changes in prices over N-period bars.
- It helps to determine the overall trend in the market.
Roger Altman developed the Relative Momentum Index (RMI) indicator and introduced it in Technical Analysis of Stocks and Commodities magazine in 1993. Altman developed the RMI indicator to improve the readings of the classic Relative Strength Index (RSI) when the prices fall in the territories of overbought/oversold levels.
The Relative Momentum Index calculates a ratio of upwards changes to downwards changes in prices over N-period bars. The RMI values range between 0 and 100. 30 and 70 are the two levels of oversold and overbought market conditions respectively. As the RMI indicator is closely related to the RSI, its interpretation and analysis is also similar to the RMI. The RMI indicator is an extremely helpful technical analysis tool that helps to determine the overall trend in the market and buying/selling opportunities.
The formula of the Relative Momentum Index
Relative Momentum Index = N / (PCP + NCP)
Where N is the total number of days, PCP is the sum of changes in positive closing prices for the days between today and N days ago, and the NCP is the sum of changes in negative closing prices for the days between today and N days ago.
What does the RMI tell traders?
The RMI indicator is a classical momentum indicator that conveys useful information to the traders and technical analysts. It helps traders to recognize possible trading opportunities. During a downtrend, it indicates the continuation of the downtrend when the RMI values rise above 70%. The level between 70 and 90 is generally considered overbought. When the RMI values further increase, the chance of decline increases. During an uptrend, when the RMI values rise above 30%, it is an indication of the end of the price correction and an upcoming uptrend. The level between 10 and 30 is generally regarded as oversold.
How to trade with the Relative Momentum Index?
The Relative Momentum Index issues signals that are easy to interpret and use in trading. Traders can use the following trading strategies when using the RMI indicator.
- But when the RSI rises above 70 from below.
- Close a long position when the RSI falls below 70.
- Go short when the RSI falls below 30.
- Cover shorts when the RSI rise above 30 from below.
Although the RMI indicator helps greatly in trading, technical analysts and expert traders always suggest using the Relative Momentum Index in combination with other handy technical analysis tools to achieve profits. It is also necessary to avoid fake trading signals.