
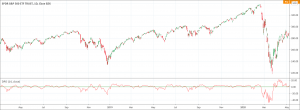
- The Detrended Price Oscillator (DPO) helps to eliminate the long-term trends in prices.
- To do so, it measures distance between extreme highs and lows.
Gerald Appel developed the Detrended Price Oscillator (DPO). It is a technical analysis tool that helps to eliminate the long-term trends in prices. The DPO employs a displaced moving average for elimination of cycles longer than the moving average. As a direct result of its mechanism, the DPO indicator doesn’t respond to the most current price action.
In simple words, the Detrended Price Oscillator effectively removes the influence of the market’s general trend from the price action. Hence, the DPO make it easy for the technical analysts and traders to identify cycles. It is important to note that the DPO indicator is not a momentum-based indicator. Therefore, it helps to assess high and low points within a cycle and also helps to estimate its length. The mechanism of the DPO also allows it to highlight intermediate levels of overbought/oversold market conditions effectively.
How does the Detrended Price Oscillator work?
The Detrended Price Oscillator works to isolate short-term cycles from the long-term cycles. The DPO indicator does it by comparing closing price to the previous moving average near the middle of the chosen time period. Figures higher than the simple moving averages indicate that the DPO is in overbought levels. Figures lower than the simple moving averages suggest that the DPO is in oversold levels.
How to calculate the Detrended Price Oscillator?
To calculate the Detrended Price Oscillator, it is necessary to choose a time period such as prior 20 periods. Secondly, find the closing price n periods ago. The formula for finding n periods is:
n periods = (x / 2) + 1
If using a 20 periods, the n periods will be 11. Now, calculate the simple moving average of the chosen time period. It is 20 in the current example. Finally, subtract the simple moving average from the closing price (x/2) + 1 periods ago to achieve the value of the DPO. The formula for the Detrended Price Oscillator is:
DPO = Closing Price of the (x/2) + 1 periods ago – Chosen time period’s simple moving average
What does the DPO indicator tell traders?
The DPO indicator helps traders to identify the price cycle of an asset. Traders arrive at this conclusion by observing the highs and lows on the DPO indicator aligned to the highs and lows in prices. This alignment makes a vertical line and traders can easily count the time elapsed between them.
How to use the DPO indicator for trading?
Traders may use the Detrended Price Oscillator for trading by keeping in mind the following key points.
- Suppose that the bottoms are two months apart, traders can easily assess when the next buying opportunity will appear. It can be done by isolating two recent lows on the DPO indicator and in price and then project the next bottom two months later.
- Suppose that the ups are two months apart, traders can easily assess when the next selling opportunity will appear. Traders can easily identify the most recent highs and then project the next high two months later.
- The distance between a high and a low can help to estimate the length of a short trade.
- The distance between a low and a high can help to estimate the length of a long trade.