
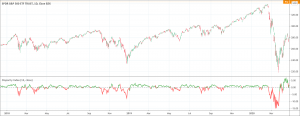
- The Disparity Index is a momentum indicator.
- It shows which direction a security is heading compared to a moving average.
- Big moves can hint for a price correction (it acts like a overbought/oversold situation).
Disparity index (DI) indicator is a technical momentum indicator that measures an asset’s percentage value of current closing price relative to the moving average. In simple words, it helps a comparison between the current market price with the moving average of price over a particular period of time. A positive percentage indicates increasing price of the asset while a negative percentage shows decreasing price of the asset. Traders use the DI to know overbought/oversold market conditions of an asset that may bring sudden price reversals.
Disparity index indicator’s calculations
Disparity index indicator calculates the deviation from a specific moving average in terms of percentage. For example, a stock price is $10 and the 14-days moving average of that stock is at 5. In this scenario, the DI will be 10 – 5 = 5%. If the DI is 0, it means that the current price is equal to moving average. If the DI is greater than 0, it means the current price is greater than the moving average. Conversely, if the DI is smaller than 0, it means the current price is lower than the moving average. The disparity index indicator’s formula is:
Disparity index = (current market price – n periods moving average) / (n periods moving average × 100)
What does the disparity index indicator tell traders?
Disparity index indicator is a simple indicator but it conveys useful information to the technical analysts and traders. A positive percentage indicates rising price while the negative percentage suggests falling price. It also gives an early signal of imminent change in the trend when the crossover above the zero line happens. It is also important to note that any extreme changes in either direction predicts an upcoming price correction.
How to trade with the indicator
Whenever the disparity index crosses the zero line, the indicator generates very useful signals. A change in the trend is imminent when the indicator crosses the 0 line. A price correction is inevitable when the indicator shows extreme values. The DI indicator shows extreme values because the assets fall into the overbought/oversold levels. Extreme values suggests to the traders that the trend reversal is on the cards and traders should not follow the trend anymore. Values above zero indicate the upward momentum while the values below zero suggest a selling pressure during the downward trend. Divergences can also be noticed with the help of the DI indicator. Whenever the indicator and the price are not moving in the same direction, it suggests a divergence.
Precisely, the disparity index indicator is quite useful indicator when it seems dangerous proposition to follow the trend of a particular asset. Moreover, technical analysts and experts always suggest to use the DI indicator in conjunction with any other technical analysis tools for confirmation of all the assumptions.