
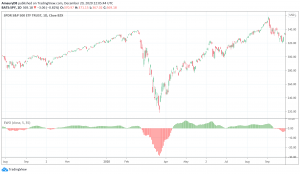
- The Elliott Wave Oscillator (EWO) oscillates with the price.
- It helps traders observe when an existing wave ends and when a new one begins.
- It is the difference between 2 different moving averages (with different period).
The Elliott Wave Oscillator (EWO) is based on the Elliott Wave Theory created by an accountant by the name of Ralph Nelson Elliot. The Elliott Wave Theory holds that prices move in a pattern and do not move in a chaotic way. According to the theory, upwards or downwards movements of prices repeat the same patterns. However, Elliott noted that price movements are misleading and make it difficult for the traders to know about the occurrence of a formation.
The Elliott Wave Oscillator was the answer. The EWO indicator enables traders to track the waves. It allows traders to observe when an existing wave ends and when a new one begins. The EWO works on the basis of a simple calculation. It is actually a difference between a 5-period simple moving average and a 34-period simple moving average. Hence, the formula of the Elliott Wave Oscillator is:
Elliott Wave Oscillator = 5-period simple moving average – 34-period simple moving average
How does the Elliott Wave Oscillator work?
The Elliott Wave Oscillator was developed with the objective of helping traders to identify when an Elliott wave ends and when it starts. In simple words, it helps traders to determine when market price movements change directions. The EWO indicator achieves this by presenting EWO values as bars of the histogram. The bars are above the zero line when EWO values are positive and vice versa.
How to interpret the Elliott Wave Oscillator?
The EWO interpretation requires knowledge of the Elliott Wave Theory and a lot of practice. However, it gets simple if traders fully understand the basics. First of all, it is imperative to note that divergence of the EWO indicator and prices is often an indication of the beginning of new waves. Secondly, trend reversals occur where we find wave 1. Thirdly, waves 2 and 4 are correction waves that must be dealt with caution. Wave 2 is a correction to reversal. In such a scenario, the market is unlikely to reach new heights. Rather it covers only a percentage of wave 1.
Traders will observe waves 2 and 4 whenever a correction takes place. After the correction, traders will observe the strongest price move represented by wave 3. Now, the traders will observe that market and the EWO indicator reaching new extremes of highs and lows according to the direction of wave 1. The market often makes new highs in wave 5 but the Elliott Wave Oscillator does not cross wave 3. This is an indication of a divergence. A divergence is in the end a signal of potential price reversal.
Final thoughts on the EWO
The use of the Elliott Wave Oscillator depends on the trader’s knowledge of the Elliott Wave Theory. Traders can successfully trade with the EWO indicator only when they are fully aware of the Elliott Wave Theory’s trading strategies. Moreover, expert traders use it in conjunction with Fibonacci retracements. They combine the corrective waves with Fibonacci retracement. Once the retracement of wave 1 is over, the strongest price move will be on cards. Hence, the EWO is an efficient market analysis tool that makes it easier for traders to trade according to the most popular trading theory, the Elliott Wave Theory.
Additional resources to expand your learning on Elliott Wave Analysis
Want to continue learning about Elliott Waves? You might be interested in checking our shortlist of the best Elliott Waves video courses on Udemy:
- Technical Analysis Elliott Wave Theory for Financial Trading: it’ll teach you how to identify important turning points in the financial markets using advanced technical analysis
- Predict the Market with Harmonic Elliott Wave Analysis: it’ll teach you how to distinguish trending market making new highs or lows from sideways or corrective market moving in countertrend direction.
- Trading Harmonic Elliott Waves like a PRO: it’ll teach you how to create reliable micro setups to enter harmonic trades, set multiple targets and set and adjust protective stop loss orders.
- Elliott Wave – Forex Trading With The Elliott Wave Theory: it’ll give you extended information on how to integrate the Elliott Wave Theory in your trading strategy for forex.
- Elliott Wave for Beginners: it’ll help you understand how to label price wave patterns with confidence.
- Elliot Wave Principle – Key to the Market Behaviour: it’ll help you develop your knowledge base of the different rules and guidelines for carrying out Elliot Wave analysis.