
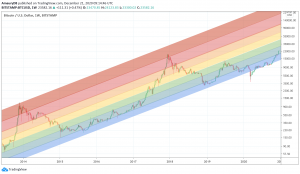
- The Rainbow Charts indicator is a technical analysis tool that follows trend.
- It helps traders buy when the price is low and sell when the price is high.
The Rainbow Charts indicator is a technical analysis tool that follows trend. It helps traders to visualize a full spectrum of trends in the market. Mel Widner developed the indicator and elaborated it in the 1997 issue of Technical Analysis of Stocks and Commodities magazine. It uses 10 simple moving averages and hence, it is a very interesting take on a simple moving average.
How does the Rainbow Charts indicator work?
The basis of the Rainbow Charts indicator are 10 moving averages. The first Rainbow Moving Average is a 2-period simple moving average. It applies recursive smoothing to this first SMA. The first moving average is the base of nine other simple Rainbow Moving Averages of different lengths. Each SMA bases on the previous SMA. The application of the recursive smoothing enables the indicator to create a full spectrum of the current trends in the market.
As we know that the financial markets are full of wonders and surprises and we have an indicator that also surprises us. Yes, it is none other than the Rainbow Charts indicator that presents information on the charts in the form of a rainbow. That is the reason that it is known as the Rainbow Charts indicator.
How to interpret the indicator?
The interpretation of the Rainbow Charts indicator is quite straightforward. The Rainbow Moving Average with the least recursive smoothing stays at the very top of the Rainbow during a bullish trend in the market. Conversely, the moving average with the most recursive smoothing stays at the bottom of the Rainbow.
On the other hand, the positions of the least and the most smoothed moving averages reverses during a bearish trend in the market. Now the least smoothed moving average stays at the bottom while the most smoothed moving average stays at the top of the Rainbow.
The Rainbow Charts indicator’s moving averages track the uptrend or downtrend in the market. The moving averages track the trend as it progresses and cross each other in a sequential order. The distancing of the price from the Rainbow indicates the continuation of the current market trend. Conversely, if the price moves closer to the Rainbow, it suggests that a potential trend reversal is imminent.
How to use the Rainbow Charts indicator for trading?
The use of the indicator is also quite simple. Traders should look for initiating a buy position as soon as a strong positive move starts. Similarly, they should look for opening a sell position at the very beginning of a strong negative trend. It is important to note that the angle of the moving averages helps to identify the strength of a trend. The steeper curve suggests a stronger trend and vice versa.
Traders can also use the tool in combination with other technical analysis tools as a trend-following indicator. Traders can enter a buy position when indicators suggest a strong bullish trend. They can initiate a sell position when indicators indicate a bearish trend. Technical analysts and experts always suggest to use the Rainbow Charts indicator in combination with other technical analysis tools for successful trading.