
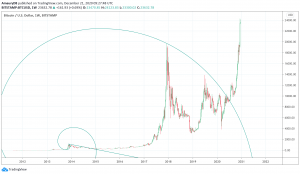
- Fibonacci spiral or Fib spiral is a technical analysis tool that helps to identify important price and time targets.
- Fib spiral is a tool that is based on the Fibonacci ratios.
Fibonacci spiral or Fib spiral is a technical analysis tool that helps to identify important price and time targets. Price and time are among the most important elements of financial trading. Proper identification of those two elements significantly increases the odds of achieving significant profits. That makes the Fib spiral one of the most useful and advantageous trading tools for financial trading.
What is the Fib spiral?
Fib spiral is a tool that is based on the Fibonacci ratios. It is actually a drawing of circular arcs connecting the opposite corners of squares in the Fibonacci tiling. The radius of the Fib spiral grows proportionately to fib ratios. Technical analysts set the first radius as the distance between two major extreme points on the trading chart. This is the main principle and the basis of correctly using the Fib spiral. It is very integral to choose this first radius properly. If traders are successful in choosing this distance accurately, the intersections of the price and Fibonacci spiral marks important price and time targets for the traders.
What does the Fib spiral tell traders?
The Fib spiral is a very useful tool that helps to forecast time and price targets. It is important to note that each intersection point on the Fib spiral indicates an optimal combo of price and time. All the corrections and changes in the direction of a trend occur at all those points where the price and time touch the growing Fibonacci spiral.
How does the Fibonacci spiral work?
The fib spiral works on the basis of a basic idea consisting of two steps. The first is to choose a particular extreme point on a market chart as the center of the spiral. Secondly, the Fib spiral is drawn from that center basing on the golden Fibonacci ratio.
Generally, traders generate the Fibonacci spiral by selecting a starting point and then gradually increase the width of points along the Fib spiral by employing a Fibonacci ratio. The width is increased by multiplying the width by a ratio for each quarter turn. The selection of the starting point is very crucial. Traders often use a strong support or resistance level which is very obvious. After that, traders expand the spiral by using Fibonacci ratios.
The Fib spiral tool emphasizes that certain points on the spiral are strong indicators of crucial market events such as levels of support and resistance. The advocates of the advantages of the Fib spiral iterate that it identifies critical price and time targets rather than simply relying on simple price levels.
The exact method of the calculation of the Fib spiral has been a secret. Traders use different software available in the market to draw the Fib spiral. However, it is very difficult to judge the efficiency and effectiveness of such software because of the secret nature of the spiral calculation.