
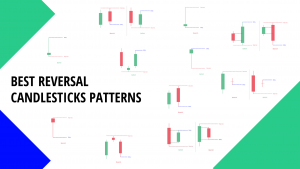
Introduction
It took close to two centuries before candlestick charts made it to the Western Hemisphere from Japan. But just a quarter century for it to become the preferred charting technique among traders from Wall Street to Main Street. History made us believe that technical analysis was initially used in 18th century feudal Japan to trade rice receipts. It later evolved into candlestick charting in the early 1800s.
What is Candlestick reversal pattern?
Candlestick patterns are vital technical tools used widely among traders to determine underlying asset price movements. They are represented like bar chart, but more informing. Candlesticks encompass opening closing high and low of an underlying asset in a single bar pattern. Candlesticks are needed for forecasting trend reversal candlestick formation each with different advantage and usefulness. We will be looking at the common and powerful ones and how to interpret them when used for trading.
What are reversal patterns?
Reversal patterns refer to the formation of candlesticks which shows the end of the existing trend (uptrend or downtrend). If such formation happens in a downtrend it represents a bullish reversal pattern or end of selling and the beginning of buying. Conversely, search formation happens in an uptrend. It indicates a bearish reversal pattern or the end of buying spree at the beginning of selling.
Candlestick patterns are visual patterns, aiding traders to visualize when there is a movement in market sentiment. And this is the reason why several traders prefer candlestick chart to order trading tools. Nonetheless, it is advisable to ensure that any trend reversal indication tallies with other popular technical trading tools before taking major action.
Reversal candlestick patterns
The candlestick pattern became famous in the Western Hemisphere as a result of Steve Nissan effort. He stated a few different reversal pattern in his book called Japanese candlestick charting techniques.
Candlestick bullish reversal patterns
As mentioned earlier, candlestick bullish reversal pattern occurs when a candlestick is formed in a downtrend. And this signals the end of selling spree and opens up the chance to make purchase. It also indicates price reversal to the upside.
There are several examples of bullish patterns
Hammer
The hammer pattern is a 1-candle pattern. It can indicate the end of the bearish trend, a bottom or a support level. The candle has a lengthy lower shadow which has to be at least twice the length of its main body. The color of the hammer is inconsequential but if it is bullish the signal would be stronger. Hammers appear very often and are simple to identify. They indicate that although bears we’re able to pull the price to a new low they failed to hold it and by the time trading ends they lost to buy is. The signal is stronger if hammer appears after a long decline in price.
Morning star
The morning star pattern is a 3-candle pattern. After a long bearish candle there is a bearish gap down. The bears are in charge but they don’t achieve much. The second candle is very small and its color is unimportant although it’s better if it’s bullish. The third bullish candle opens with a gap up and field the previous bearish space. This candle is usually lengthier than the first one. The space are not compulsory for this pattern but the reversal signal will be stronger if present
Morning Doji Star
The morning doji star is a 3-candle pattern. It is very similar to the previous one but the second candlestick is a doji. The signal of this pattern is regarded stronger than a signal from a basic ‘Morning Star’ pattern.
Inverted hammer
The inverted hammer pattern is a 1-candle pattern. This scandal has a small body and a lengthy upper shadow which has to be at least 2 times lengthy than the actual body the color of this hammer is not important although if it is bullish the signal get stronger. And inverted hammer who would require further bullish confirmation always.
Piercing line
The piercing line pattern is a 2-candle pattern. The first candle is lengthy and bearish. The second candle opens with a space down, beneath the closing mark of the first one. It is a huge bullish candlestick which closes above the 50% of the first candles body. Both bodies should be lengthy enough. This pattern indicates that even though trading commenced with a bearish move buyers were able to change the situation and seal their profits. The signal is averagely strong.
Bullish harami
The bullish harami pattern is a 2-candle pattern. The body of the second candle is utterly contained within the body of the first one and the color of the first is inverse of the second one. Harami always need verification. It’s candlestick ought to be big and bullish.
Bullish Harami Cross
The harami cross is a 2-candle pattern that looks like the Harami. The difference is that the final candle is a doji. This pattern usually look similar to the ‘Morning doji Star’ pattern. The logic and its implication are the same.
Bullish engulfing pattern
The engulfing pattern is a 2-candle pattern and it shows up at the end of a downtrend. The first candlestick is bearish. The second candle must open beneath the law of the first candlestick low and close above its high. This pattern gives a strong reversal signal has the bullish price action utterly engulfs the bearish one. The larger the difference in size of the two candle the stronger the buy signal.
Candlestick bearish reversal patterns
This occurs when a candlestick is formed in an uptrend. It equally indicates price reversal to the downside.
There are several examples of bearish pattern and they include:
Shooting star
The shooting star pattern is the 1-candle pattern. The body of the candle is small the upper shadow is lengthy and exceeds the body with at least two times. The lengthy upper shadow denotes that the market made an effort to find where resistance and supply were situated but the upside was rejected by bears. This candle can come in any color although if bearish the signal get stronger.
Evening Star
The evening star pattern is a 3-candle pattern. After a bullish candlestick there exist in space up. The bulls are in charge but they don’t drive much. The second candlestick is very small and the color is unimportant. The third bearish candle opens with a space beneath and feels the previous bullish space. This candle is usually lengthy than the first one. It’s preferable if this pattern as a space but it is not a compulsory factor.
Evening Doji Star
The evening doji star pattern is a 3-candlestick pattern. Its pattern is closely related to the ‘evening star’ but is believed to be a stronger signal as the middle candle is doji. The signal of this pattern is believed to be stronger than the signal from a basic ‘evening star’ pattern.
Hanging man
The hanging man pattern is a 1-candlestick pattern. It may indicate the end of a bullish trend a top or a resistance level. The candle has a lengthy lower shadow which ought to be at least twice the length of the actual body. The color of the candle is unimportant although if it is bearish the signal becomes stronger. This pattern needs additional bearish verification. This signal is verified if a bearish candlestick closes below the open of the candlestick on the left side of this pattern.
Dark cloud cover
The dark cloud cover is a 2-candle pattern. The first candle is bullish and has a lengthy body. The second candlestick should open well above the first ones closing mark. It should close beneath 50% of the body of the first candlestick. The sell signal is averagely strong.
Bearish engulfing pattern
This is a 2-candle pattern. The first candlestick is bullish. The second candlestick is bearish and ought to open above the high of the first candlestick and close beneath its low. This pattern forms a strong reversal signal as the bearish price action utterly engulfs the bullish one. The larger the difference in size of the two candlesticks the stronger the sell signal.
Bearish harami
This is a 2-candle pattern. The body of the second candle is utterly contained within the body of the first one and as the alternate color. Note that are Harami candlestick needs verification. Its candlestick should be big and bearish.