
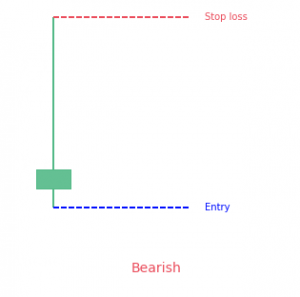
The Gravestone Doji Candlestick Pattern is one of the fabulous and versatile patterns in trading. It an interesting bearish trend reversal candlestick pattern. Some traders, use this pattern in their daily lives to learn about the feel of the market. The article is about the Gravestone Doji pattern, its purpose, use, and how traders integrate it into their trading plans.
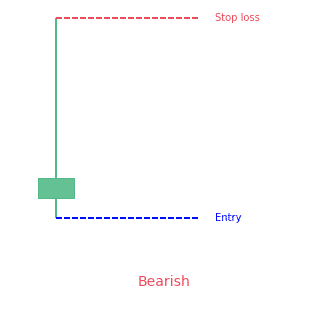
- The gravestone doji candlestick pattern is a 1-bar bearish candlestick pattern.
- It looks like an upside down letter “T”
Statistics to prove if the Gravestone Doji pattern really works
Are the odds of the Gravestone Doji pattern in your favor?
How does the Gravestone Doji behave with a 2:1 target R/R ratio?
From our research the Gravestone Doji pattern confirms 47.5% of the time on average overall all the 4120 markets we analysed. Historically, this patterns confirmed within 5.5 candles or got invalidated within 5.6 candles. If confirmed, it reached the 2:1 R/R target 39.9% of the time and it retested it's entry price level 89.1% of the time.
Not accounting for fees, it has an expected outcome of 0.196 $/$.
It means for every $100 you risk on a trade with the Gravestone Doji pattern you make $19.6 on average.
Want to account for your trading fees? Have the detailled stats for your favorite markets / timeframes? Or get the stats for another R/R than 2:1?
🚀 Join us now and get fine-tuned stats you care about!
How to handle risk with the Gravestone Doji pattern?
We analysed 4120 markets for the last 59 years and we found 199 237 occurrences of the Gravestone Doji pattern.
On average markets printed 1 Gravestone Doji pattern every 78 candles.
For 2:1 R/R trades, the longest winning streak observed was 60 and the longest losing streak was 368. A trading strategy relying solely on this pattern is not advised. Anyway, make sure to use proper risk management.
Keep in mind all these informations are for educational purposes only and are NOT financial advice.
If you want to learn more and deep dive into candlestick patterns performance statistics, I strongly recommend you follow the best available course about it. Joe Marwood (who's a famous trader with more than 45 000 Twitter followers) created an online course called "Candlestick Analysis For Professional Traders" in his Marwood Research University. There he will take you through the extensive backtesting of the 26 main candlestick patterns. He then summarizes which one is THE best pattern. Do you know which one it is?
Remember, don't trade if you don't know your stats. Click here to signup to the course now!
PS: Save 20% with the SAVE20 code.
What is the Gravestone Doji candlestick pattern?
It is the pattern in trading where open, close, and low shadows have the same price or very close to the same amount. Here the costs of open, close, and small are near the upper shadow trends. The actual purpose of the Gravestone Doji Pattern is to inform about the suggestion of the reversal trends towards the downsides when all prices and directions are at the upper side. Traders can use it with other indicators to frame their trades.
What the Gravestone Doji pattern tells traders?
The patterns give traders essential and upcoming information. It creates attention in the traders about the prices, and the profit is going downward and is low because of the same price, and the stock price is meager even in the future. And traders use this pattern when they believe that a marketer and a bull can help to reverse it and to take industry and profit from their trade. It show incertitude in the market as other doji patterns.
Gravestone Doji is a candlestick reversal pattern that assists traders to know about trading trends and mainly where hurdles and supplies of the products locates, were going low, and a passionate trader takes steps to hire a bull to have an advantage and profit in future.
How to trade the Gravestone Doji?
It is effortless for a trader expert to manage the risk and trading after identifying Gravestone patterns when open, close, and low prices are very close to each other. However, there is a short guideline in this pattern for the traders. The main thing to keep in mind while trading the Gravestone Doji pattern is to low the candlestick; when you low the candlestick, there are outcomes for you and allows you to set up and trade formation in a better way. Indirectly, a short position opportunity will appear for you here. You can consider shorting the candlestick for a short time before the bull pick up steam again. After this time and after the trading, you will get better results again when you enhance the candlestick level.
Additional information
Gravestone Candlestick is a nice trading pattern to have in your tool belt. It’s recommend to focus on the longer timeframe.
Gravestone Doji Pattern vs. Dragonfly Doji Pattern
The opposite of the Gravestone Doji Patterns is the Dragonfly Doji Pattern. It’s high, open and close prices are all the same level instead of low, free, and close rates. In Gravestone Doji Patterns, the trader follows the uptrend; on the other hand, in Dragonfly Doji Pattern, a trader follows the downtrends.
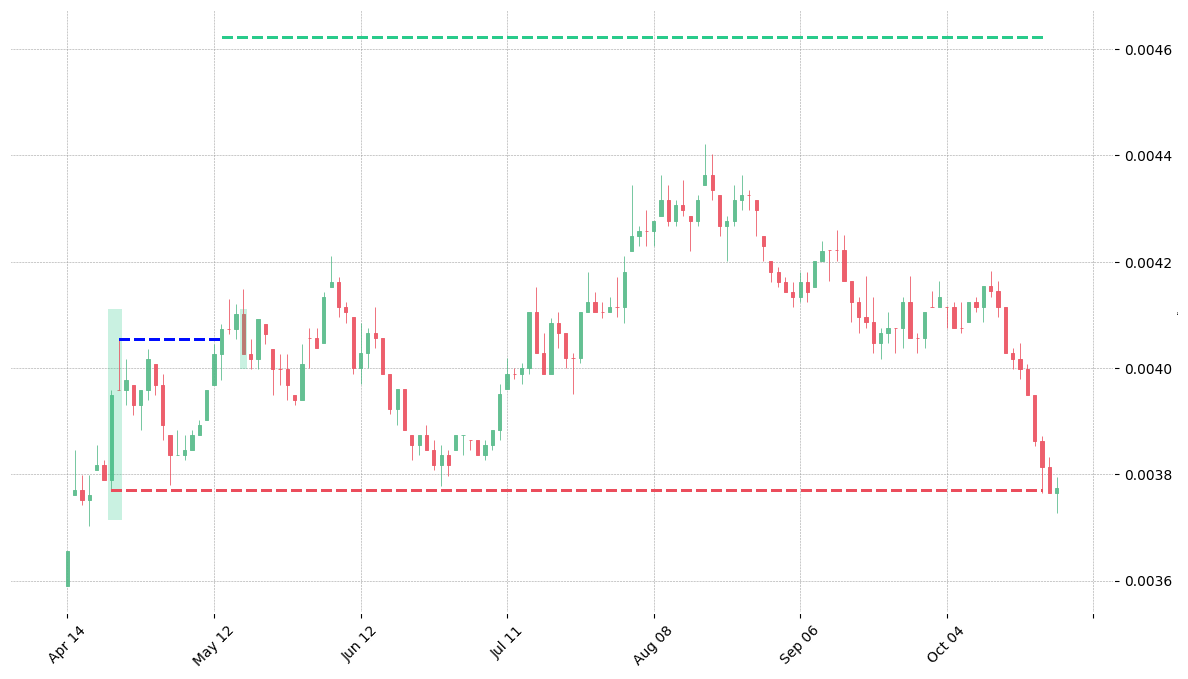
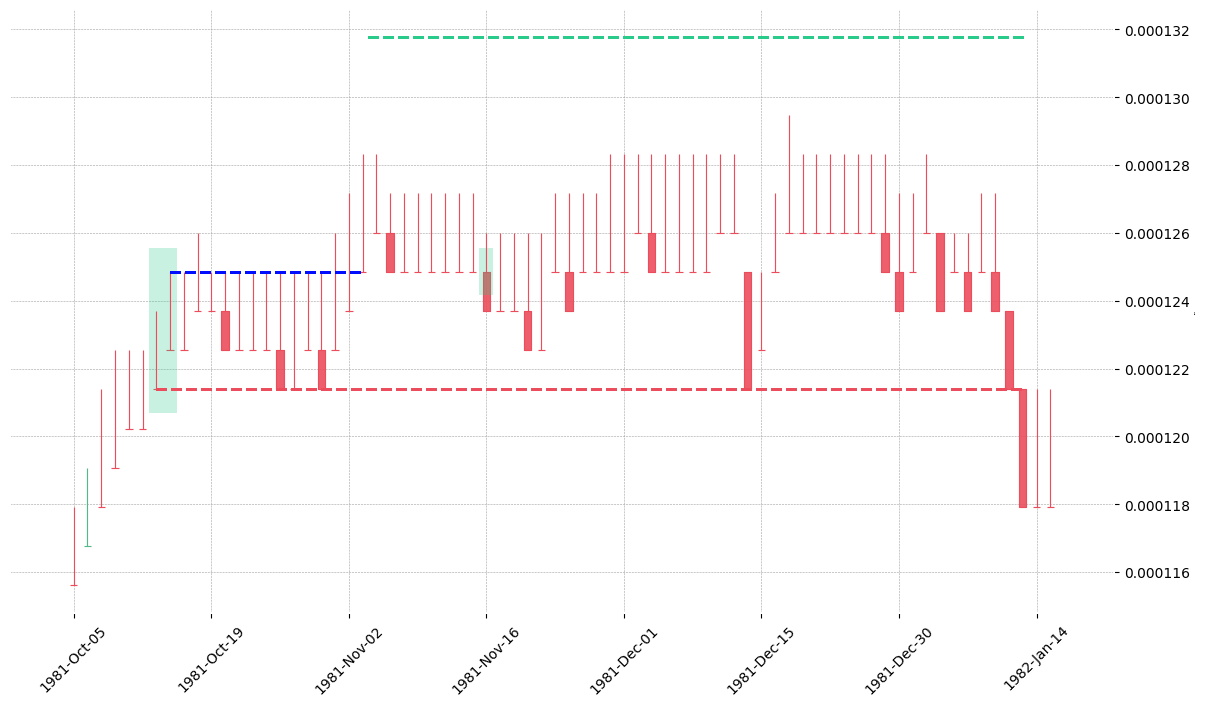
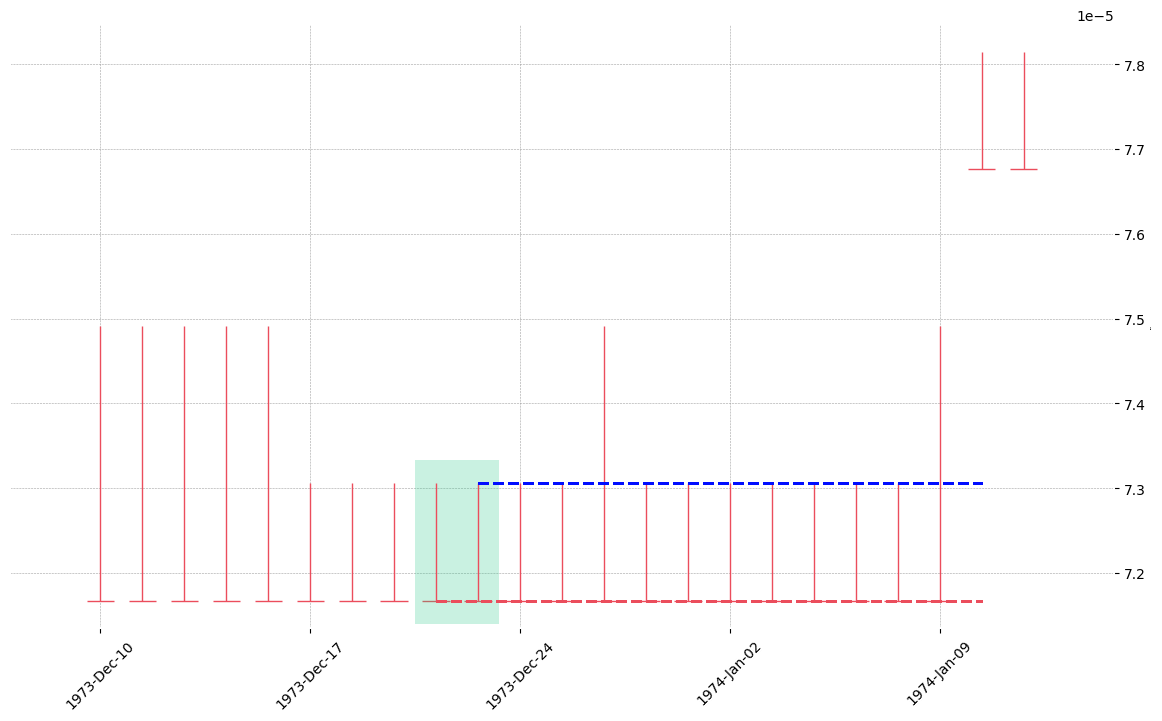
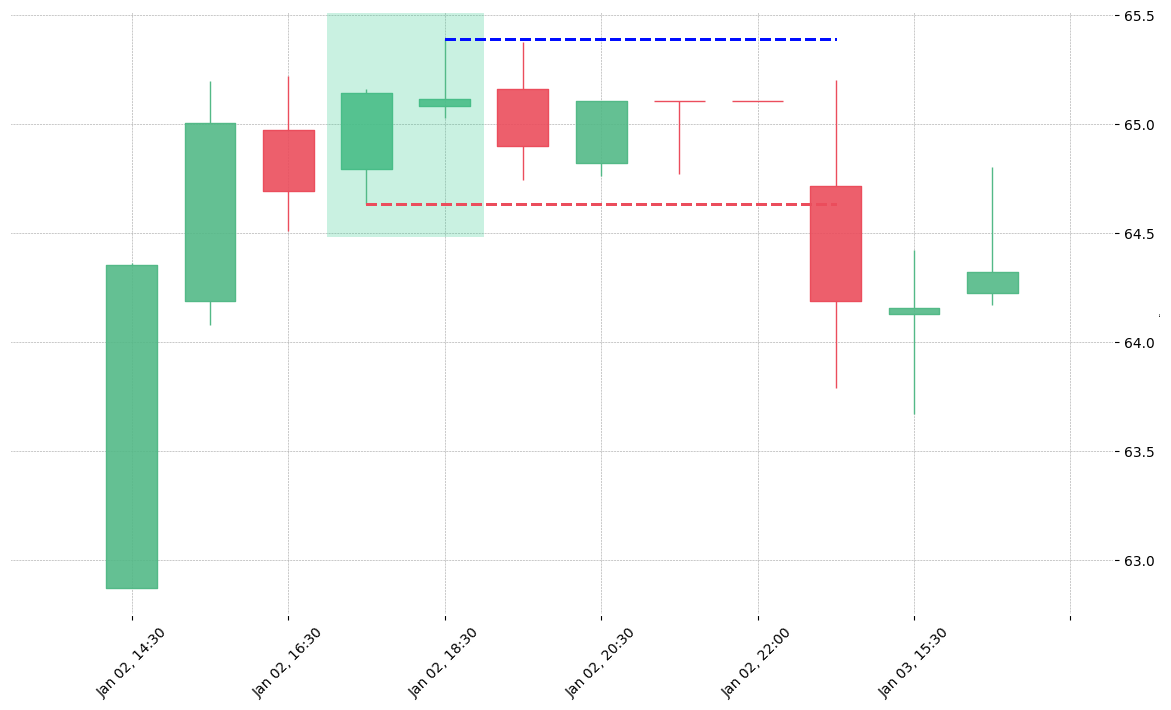
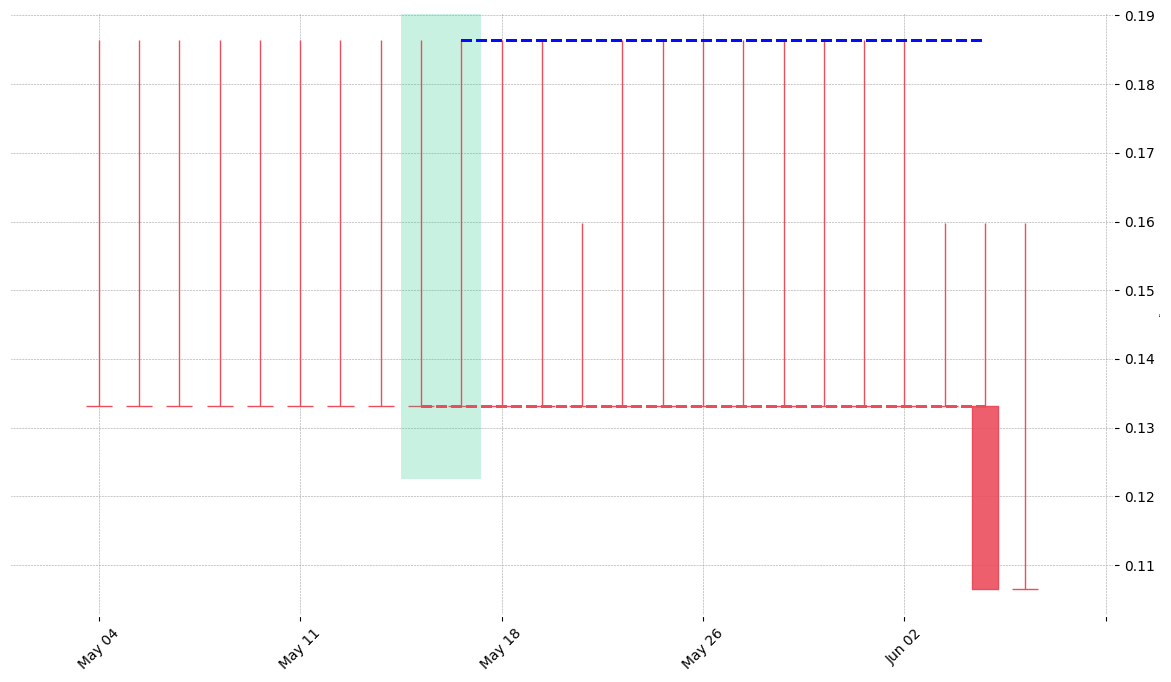
How does the Gravestone Doji pattern look in real life?
Looking to learn more about this pattern?
You should take a look at Joe Marwood's online course. In his course, he backtested the 26 main candlestick patterns before to summarize which one is THE best pattern. I really liked his course and you shouldn't miss it!
Click here to signup to his "Candlestick Analysis For Professional Traders" course now!
PS: Save 20% with the SAVE20 code.