
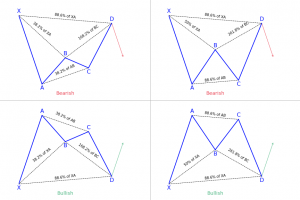
The Bat harmonic pattern is close to the Gartley pattern. It is a retracement and continuation pattern that comes up when a trend temporarily changes its direction but then continues on its original course.
- The Bat harmonic pattern is a reversal pattern.
- It follows specific Fibonacci ratios (see below for more)
Interested in learning more about harmonics pattern in general?
You’ll love this two courses I shortlisted for you on Udemy:
- Forex Harmonic Pattern Trading – With Multiple Chart Examples: it’ll teach you step-by-step how to identify most harmonic pattern applied to forex markets.
- Harmonic Trading: The Art Of Trading With Low Risk: it’ll guide you to your first harmonic trades, what are potential reversal zones and it’ll give you practical applications so you can truly understand how to use it and manage risk.
If you prefer to skip the learning part and are just looking for a harmonic patterns scanner, you might want to check this harmonic patterns screener here. You’ll get a 7-days free trial (+ 50% off your 1st month subscription if you decide to continue).
Or you can just continue reading and learn more with our article below about Bat patterns.
What is the Bat harmonic pattern?
The pattern is a 5-point retracement structure that was discovered in 2001 by Scott Carney. It has particular Fibonacci measurements for every point within its structure. It is necessary to note that D is not a point, but rather a zone in which price is probably going to reverse. This zone is known as the Potential Reversal Zone (PRZ).
The B point retracement of the primary XA leg has to be lower than a 0.618, preferably a 0.50 or 0.382. The PRZ is made up of 3 converging harmonic levels:
- 0.886 retracement of the primary XA leg
- Extended AB=CD chart pattern, mostly 1.27 AB=CD
- Minimum BC projection is 1.618
The first target might be the 382 retracements of AD and the second target the 618 retracements of AD. A popular stop-loss level would be behind the X-point. Conservative traders may wait to get additional confirmation before trading. Bat patterns can be bearish and bullish.
You are looking for another chart pattern, you can find them all here explained in detail.
How to identify the Bat harmonic pattern?
Fibonacci ratios define the pattern
The bat harmonic pattern follows different Fibonacci ratios. One of the major ways to differentiate it from a Cypher pattern is the B point which, if it doesn’t go above the 50 percent Fibonacci retracement of the XA leg then it is a bat, otherwise it can turn into a cypher structure.
The market strategy of the pattern is suitable for all time frames and all markets types. Traders have to keep in mind that on lower time frames using the bat pattern market strategy has some challenges because the pattern tends to appear on less frequent on lower time frames.
4 legs pattern
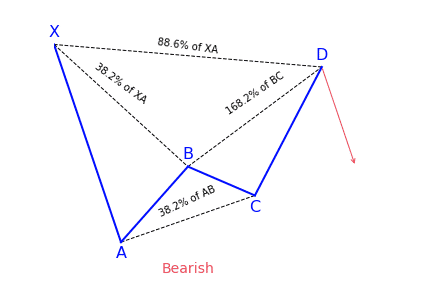
As mentioned earlier, the bat harmonic pattern looks very similar to the Gartley pattern. It has four different legs marked as X-A, A-B, B-C, and C-D.
- X-A: In its bullish version, the first leg appears when the price sharply increases from point X to point A. This is the longest leg of the pattern.
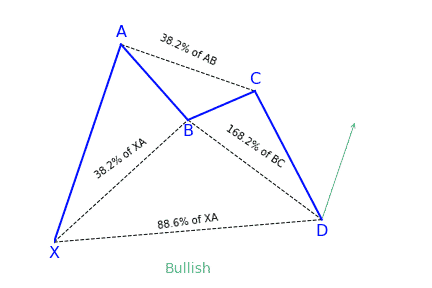
- A-B: The A-B leg then sees the price switching direction and retracing 38.2 to 50 percent of the distance covered by the X-A leg. Have it in mind that the A-B leg can never retrace beyond point X. But if it does, the pattern is considered invalid.
- B-C: Here, the price changes direction for a second time and moves back up, retracing anything from 38.2 to 88.6 percent of the distance covered by the A-B leg. If it retraces up above the high of point A, the pattern is considered invalid.
- C-D: This is the last and most significant aspect of the pattern. As with the Gartley pattern, this is where the bat harmonic pattern ends and traders place their long (buy) trade at point D.
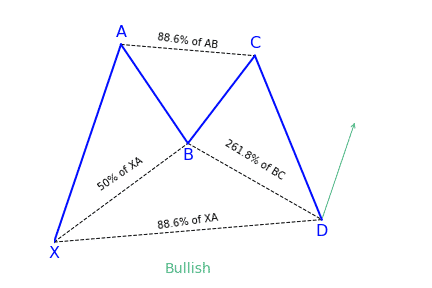
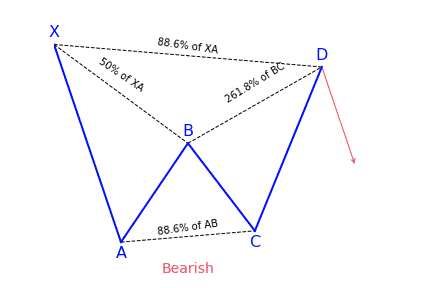
However, with the bat pattern, traders look to place their entry trade order at the location where the C-D leg has reached an 88.6 percent retracement of the X-A leg. Ideally, point D should also represent a 161.8 to 261.8 percent extension of the B-C leg.
What does the Bat pattern tell traders?
It offers traders the opportunity to enter the market at a good price, just as the pattern completes and the trend resumes. The main difference of the bat pattern to the Gartley pattern is where it completes – at an 88.6 percent Fibonacci retracement of the X-A leg. Its inner retracements are also slightly different.
The harmonic bat pattern teaches traders how to trade the bat pattern and begin earning money with a new exciting approach to technical analysis. The market strategy of the pattern is part of the harmonic trading patterns system of trading. Just as it is with many harmonic patterns, there is a bullish and a bearish version of the bat pattern.
How to trade when you see the Bat pattern?
Before trying and trading the pattern, confirm from this checklist that the pattern is real. It should include these vital elements:
- An AB=CD pattern or an extension of this pattern
- An 88.6 percent Fibonacci retracement of the X-A leg
- A 161.8 to 261.8 percent Fibonacci extension of the B-C leg
Next will be to look at how traders can trade using the bat pattern. We will make use of the bullish bat pattern as an example. For a bearish bat pattern, simply do the opposite for your orders.
The first thing to look for when looking for this pattern is the impulsive leg or the XA leg. We are trying to identify a strong move up or down depending if we either have a bullish bat or a bearish bat pattern.
The next thing that needs to be satisfied for an authentic bat pattern structure is a minimum 0.382 Fibonacci retracement of the XA leg and it can go as deep as 0.50 Fibonacci retracement of the XA leg, but it cannot break below the 0.618. This will form the B leg of the pattern.
The next thing traders should do is to look for a retracement of the AB leg up to at least 38.2 percent Fibonacci ratios, but it cannot exceed the 88.6 percent, and this will form the third point C of the pattern strategy.
The last thing to do is to establish is the D point, and to get to the D point, find the 0.886 Fibonacci ratios of the impulsive XA leg, which will lead to a deep CD leg, and finally, it will complete the entire structure of the pattern.
Market strategy
The market strategy of the pattern has been tested across various classes of assets (commodities, currencies, stocks, and cryptocurrencies). It is recommended that traders should take the time and back-test the bat harmonic patterns strategy before using this advanced pattern for trading.
Step 1: Drawing the pattern
- Begin by clicking on the bat pattern indicator that is found on the right-hand side toolbar
- Identify the beginning point X, which can be any swing high or low point on the chart
- After identifying the first swing high/low point, simply follow the market swing wave movements
- You should get 4 points or 4 swings high/low points that join and form the harmonic bat pattern strategy
Step 2: Trading the pattern
The 88.6 percent Fibonacci ratio provides traders a more reliable risk/reward ratio which is why the market strategy of the bat pattern is such a very popular as a market strategy. The best entry point is the 88.6 percent Fibonacci retracement which is a very accurate market turning point.
It is recommended that traders should enter as soon as they touch the 88.6 percent figure. Oftentimes the harmonic bat pattern strategy doesn’t go much above this level.
Step 3: Placing a stop-loss
Usually, traders should place their protective stop-loss lower than the point X of a harmonic bat pattern. That is the only logical location to hide the stop-loss because any break below will automatically invalidate the pattern.
Step 4: Take-profit margin
There can be several ways to manage your trades, but the best target for this pattern should be to use a multiple take profit formula. For this pattern strategy, take the first partial profit once you hit wave-C level and the remaining half once we break above wave-A.
By doing this you will accomplish two things:
- first, you’ll ensure that you accumulate profits,
- and secondly if the markets reverse, you ensure you’re stopped at BE and don’t lose any money.

Looking for a way to automatically find harmonic patterns in your favorite markets?
You definitely need a screener for that! Check out this harmonic patterns scanner here!
If you come from us (simply click the link below), you’ll get a 7-days free trial and 50% off your first month’s subscription fee. Don’t think more, go test it out for free now!
Click here to signup and claim your 7-days free trial to the best harmonic pattern scanner.