
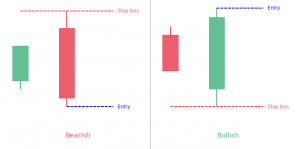
Most times, traders take a ‘ready, fire, aim’ process to trade which is a backward way of trading. Trade is different from a trade trigger. A trade setup that most traders are always on the lookout for is a key reversal bar pattern combination.
It forms when prices make a new extreme, yet close above or below the other two closes. The current high and low of the bar are above and below the previous high and low of the price bar.
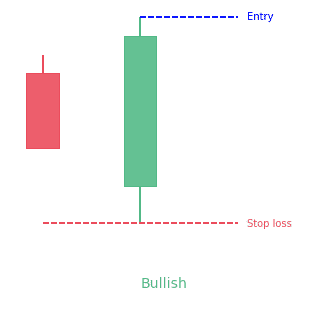
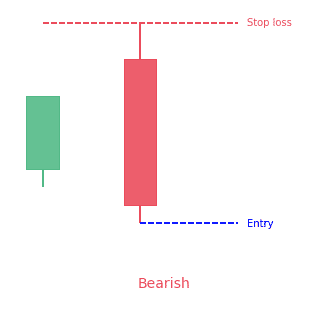
It is vital to note that this candle pattern is a setup only, and not an indication to immediately trade. For this formation to become tradable, it has to prove itself by trading above the high or low of the key reversal bar. If the high of the key reversal bar is penetrated, then the low may act as a previous protective stop for long entries. and vice versa for short entries.
- The key reversal bar pattern is a 2-bar pattern.
- The first candle is typically small and the second one engulfs the first one.
- It can be bullish or bearish.
What is the Key Reversal Bar pattern?
A one-day reversal that comes up when a market obtains a new high/low, preferably an instant high/low, called an uptrend, and then reverses to close the trade at or close to the low/high, called a downtrend, of the price bar. The meaning is that the market has had an extreme intraday sentiment change and a reversal is likely to occur.
A key reversal helps to indicate the reversal of a trend. When there’s an uptrend, prices get to a higher high and then close less than the previous candlestick. In a downtrend, the opposite happens; prices get to a lower low then close higher than the previous candle.
One common application of this concept is to identify short-term changes in direction on daily candles for swing trading. However, this method can also be sued to shorter and longer-term bar intervals.
How to identify the Key Reversal Bar?
Key reversal bars can be described in many ways. Each trader has their ideas and opinions about their importance and how they should be utilized. These bars can mostly resemble an outside day, a hammer candle or a pin candle. If you’re a candlestick watcher, you will be familiar with those.
Detecting the important patterns takes more than just eyeballing the formation of the bar. The ones you need to watch are the reversal bars that come up at vital highs, lows, support, resistance or after a chart pattern has been completed, or is about to play out.
Key reversal bars give traders a fantastic way to get into the trend with an obvious location for a stop, and great profit potential if the trend is strong enough. This is a great risk versus reward.
What does the Key Reversal Bar pattern tell traders?
A key reversal at the top of an uptrend and it tells traders when prices are making higher highs and higher lows. It is followed by another bar whose high price is higher than the high of the previous day (usually the open is also above the high of the previous day), and whose low and close is below the low of the previous day.
The psychology of the pattern acts as follow. An uptrend is happening, prices open greater and make another new high, showing that buyers are in control. Yet by the end of the day prices decrease lower than the low of the previous day. Buyers were not able to keep prices at higher highs and were not able to defend keeping prices above the low of the previous day. The lower low established by the key reversal is a good warning of a potential trend change.
A key reversal below a downtrend happens when prices are achieving lower highs and lower lows. Therefore, the definition of a downtrend, followed by another bar whose low price is lower than the low of the previous day, usually the open is lower than the loss of the previous day as well, and whose high and close is greater than the high of the previous day. The start of the key reversal day resembled a continuation of the downtrend, which is lower lows. Yet by the end of the trading day prices made a higher high, warning of a possible trend reversal.
How to trade when you see the Key Reversal Bar?
Selecting any low or high just won’t be enough. You want to see these reversals either squeeze a new recent low or high that is rejected, or retest the support/resistance levels and fail.
Swing highs are great patterns to watch for. The key reversal bars will often squeeze toward a swing high (or low) and get rejected because no volume is found. You can then proceed and trade the break of the key reversal bar, going away from the resistance or support points. For support, the same method can be used in reverse.
The entry point of this strategy is on the open of the candlestick following a key reversal. The exit point is where either the stop-loss or profit target is reached. This strategy can also reverse from short to long or long to short before getting to either the profit or stop points.
Long entry
If the present bar
- makes a new bar low
- and the close of the recent bar is more than the close of the previous bar,
then enter the trade.
Short entry
If the present bar
- makes a new high
- and the close of the recent candlestick is lower than the close of the previous candlestick,
then sell the trade.
Exit points
Cover or sell with a limit order at a particular profit target.
Lower risk trading reversals
Some trading processes can sometimes make the initial risk quite large, because the outside day bar can be long.
If you notice a key reversal bar pattern, one less risky way to jump on the move, and have a better stop-loss point is to wait for hesitation in the trend right after the reversal occurs. To get those short hesitations you only need to detect an inside day or bar.
An inside day is the exact opposite of the outside day, meaning that the current day low and high have been within the low and high of the previous day. This indicates that the market is not sure what to do next, but trends will often continue. Having that in mind, traders should wait for an inside day after a key reversal bar, then sell the break to the trend direction.
Importance of a Key Reversal
Just as it is with any other technical analysis patterns, having the ability to determine a turn in a trend adds one more tool technical investors can make use of to get potential entry and exit points.
The pattern can provide information for early entry into reversals. But without confirmation, such as from momentum divergences or other indicators, trading key reversals can be a very high-risk method. The ease of entry and the clear rules linked with trading it, make the pattern a simple one to detect and to execute.
Conclusion
These patterns are simple to spot once you start looking for them. They give plain as day places to place a stop-loss. They allow traders to lower their risk quickly if they run in your direction right away.
For new traders without much experience, try using the inside day reversal method first. It is more assured and offers lower risk. Once you get used to finding the reversals, you can maybe try a trade right of the break of one.