Piercing Line Candlestick Pattern: Full Guide

Candlestick patterns
Piercing line candlestick pattern

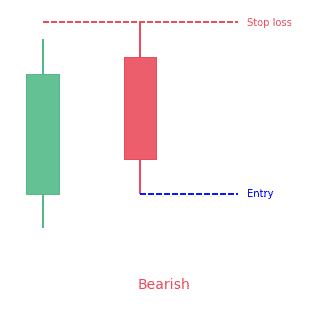
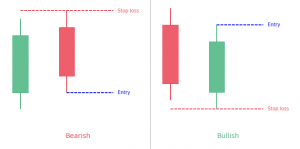
A Piercing line candlestick pattern is a two-day bullish candlestick reversal pattern that appears in a downtrend. It signals a potential short term reversal from downwards to upwards. It consists of two major components, a bullish candle of day 2 and a bearish candle of day 1.

The Piercing pattern depends upon the near high opening prices of day 1 followed by the near low closing prices of day 2. The trading range of the Piercing pattern may vary from an average to a larger size.

The gap down after the first day is also part of this pattern. The gap shows the beginning of the day 2 trading that opens near the low and closes near the high. It is also interesting and very important to note that day 2’s price gap downs are only for the sake of filling gaps. It usually closes into the losses made in the first day’s bearish candlestick. Being a bullish candlestick pattern, Piercing Pattern prompts a trend reversal when the bulls push prices high.

  • The Piercing Line candlestick pattern is a 2-bar reversal pattern.
  • The pattern has of a bearish candle and then a bullish candle gapping down and taking back at least 50% of the prior candle.

Statistics to prove if the Piercing pattern really works

Are the odds of the Piercing pattern in your favor?


How does the Piercing behave with a 2:1 target R/R ratio?

Success rate

From our research the Piercing pattern confirms 72.9% of the time on average overall all the 4120 markets we analysed. Historically, this patterns confirmed within 2.3 candles or got invalidated within 4.3 candles. If confirmed, it reached the 2:1 R/R target 39.5% of the time and it retested it's entry price level 95.5% of the time.
Not accounting for fees, it has an expected outcome of 0.185 $/$. It means for every $100 you risk on a trade with the Piercing pattern you make $18.5 on average.
Want to account for your trading fees? Have the detailled stats for your favorite markets / timeframes? Or get the stats for another R/R than 2:1?
🚀 Join us now and get fine-tuned stats you care about!

How to handle risk with the Piercing pattern?


We analysed 4120 markets for the last 59 years and we found 11 499 occurrences of the Piercing pattern.
On average markets printed 1 Piercing pattern every 1 357 candles.

For 2:1 R/R trades, the longest winning streak observed was 9 and the longest losing streak was 18. A trading strategy relying solely on this pattern is not advised. Anyway, make sure to use proper risk management.

Stack the odds in my favor NOW!

Keep in mind all these informations are for educational purposes only and are NOT financial advice.

If you want to learn more and deep dive into candlestick patterns performance statistics, I strongly recommend you follow the best available course about it. Joe Marwood (who's a famous trader with more than 45 000 Twitter followers) created an online course called "Candlestick Analysis For Professional Traders" in his Marwood Research University. There he will take you through the extensive backtesting of the 26 main candlestick patterns. He then summarizes which one is THE best pattern. Do you know which one it is?
Remember, don't trade if you don't know your stats. Click here to signup to the course now!
PS: Save 20% with the SAVE20 code.

How a Piercing Line candlestick pattern is formed? 

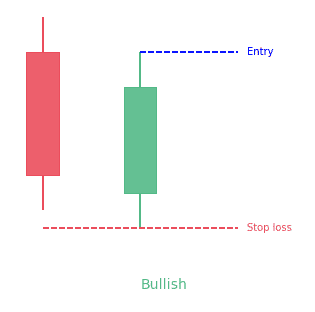
As we have discussed earlier that a Piercing candlestick pattern consists of two candles. It is formed when day 2’s bullish candle closes above the middle of the bearish candle of day 1. Moreover, it only forms during a downtrend in prices, and price gaps at the beginning of day 2 are also a must. 

How to identify a Piercing candlestick pattern? 

To identify a Piercing candlestick pattern, all the elements of its formation must be kept in mind. You should look for a pattern with two candlesticks. The second candlestick begins below the low of the bearish candle and closes above the middle of it. Bearish candlestick is usually of a red or any other dark color signifying a downtrend. The second candle is of a lighter or green color that signifies a high closing day. A Piercing candlestick pattern is a kind of special signal whenever it is formed because the reversal of the pattern is highly unexpected. 
What does the pattern tell traders? 

The first candlestick pinpoints a bearish trend in the trading market. The second candlestick opening with a bearish gap presents high expectations of bears. However, the second candle closes against the expectations of bears on a strong bullish note. Therefore, a Piercing pattern tells traders of an upcoming change of trend and also signals that bearish traders are now losing control. 

How to trade a Piercing candlestick pattern? 

Technical analysts and experts use other indicators as well to confirm a buying signal given by a Piercing line candlestick pattern. As a Piercing pattern indicates that bears lose control, as a result, a bullish movement is more likely. The bullish advancement on the second day also confirms that bulls have taken control of the market. This win of the bulls over bears is considered as a buying signal. Although a Piercing pattern signals a trend reversal, experts do not suggest to rely only on it. It is advised and recommended to use further support signals in conjunction with the Piercing candlestick pattern.

How does the Piercing Line pattern look in real life?
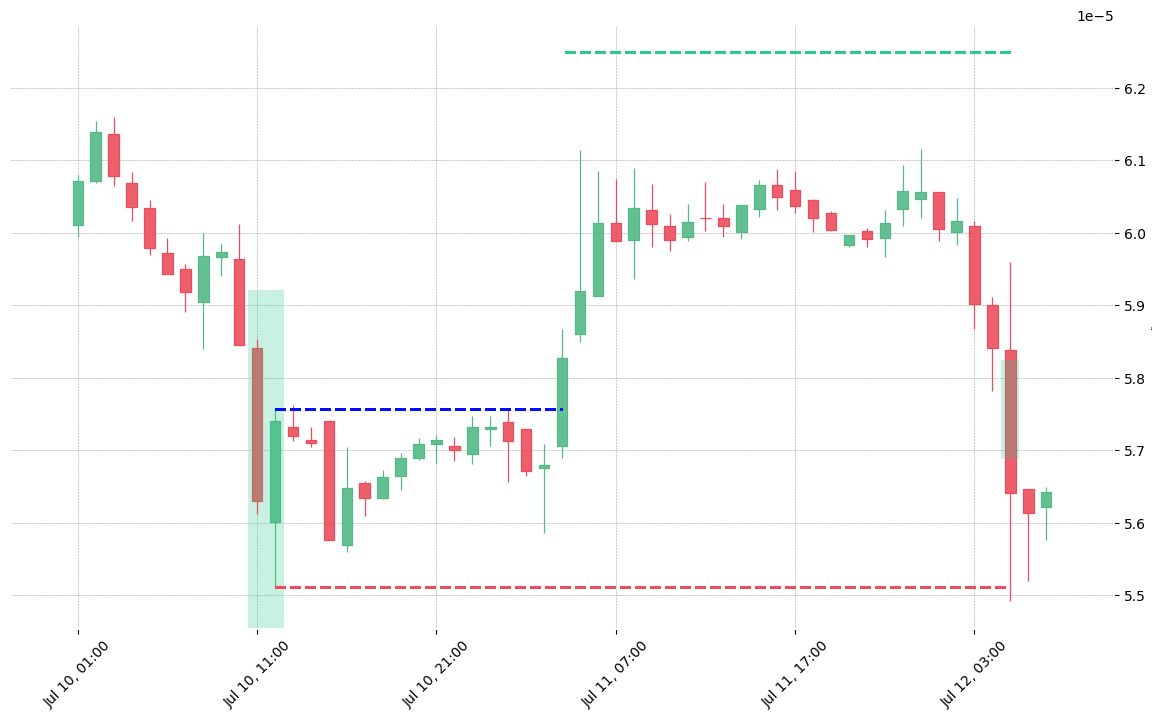
The cryptocurrency pair NULS/BTC printed a bullish Piercing on 2020-07-10 11:00:00. It confirmed on 2020-07-11 04:00:00 (meaning price closed above entry level). It retested the trade entry level on 2020-07-12 05:00:00. Then it failed to reach the 2:1 R/R target and got stopped on 2020-07-12 05:00:00.
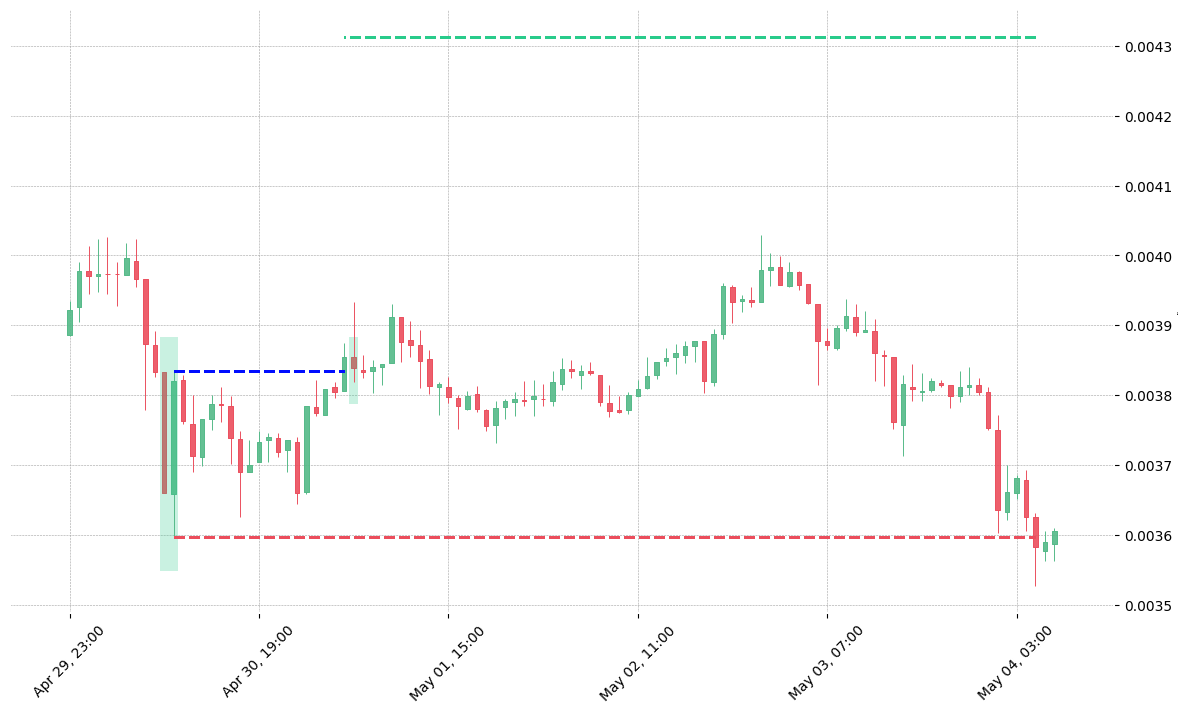
The cryptocurrency pair IOST/USDT printed a bullish Piercing on 2020-04-30 09:00:00. It confirmed on 2020-05-01 04:00:00 (meaning price closed above entry level). It retested the trade entry level on 2020-05-01 05:00:00. Then it failed to reach the 2:1 R/R target and got stopped on 2020-05-04 05:00:00.
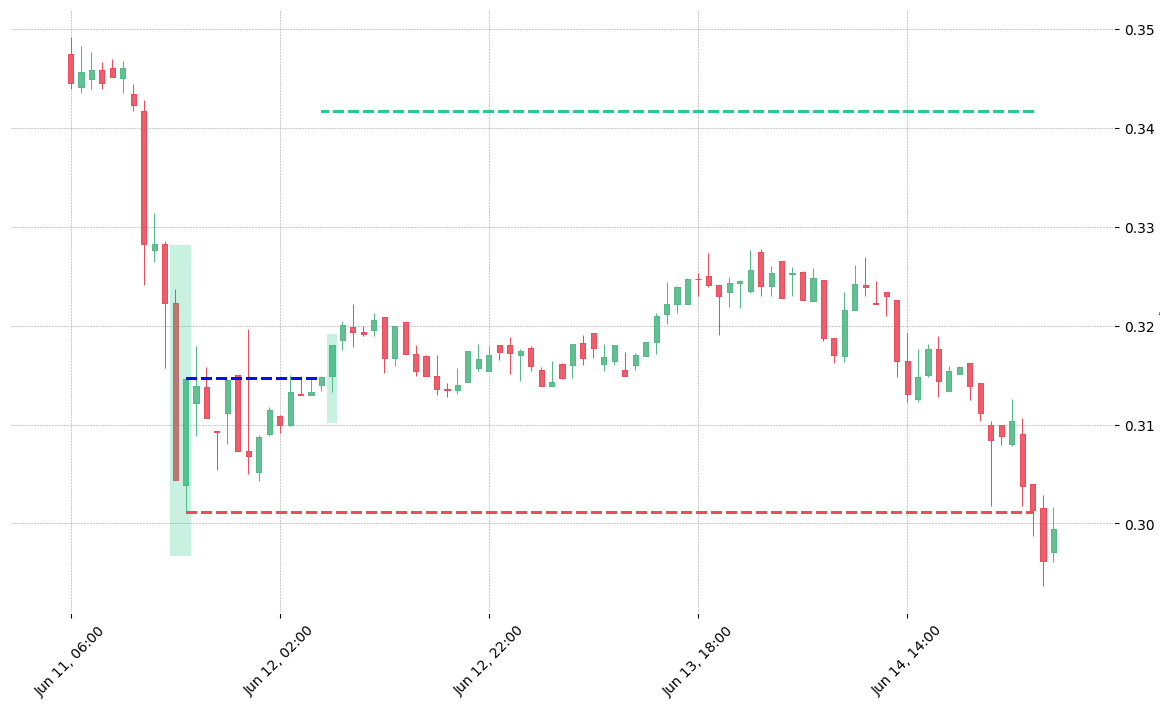
The cryptocurrency pair MTL/USDT printed a bullish Piercing on 2020-06-11 16:00:00. It confirmed on 2020-06-12 06:00:00 (meaning price closed above entry level). It retested the trade entry level on 2020-06-12 07:00:00. Then it failed to reach the 2:1 R/R target and got stopped on 2020-06-15 02:00:00.
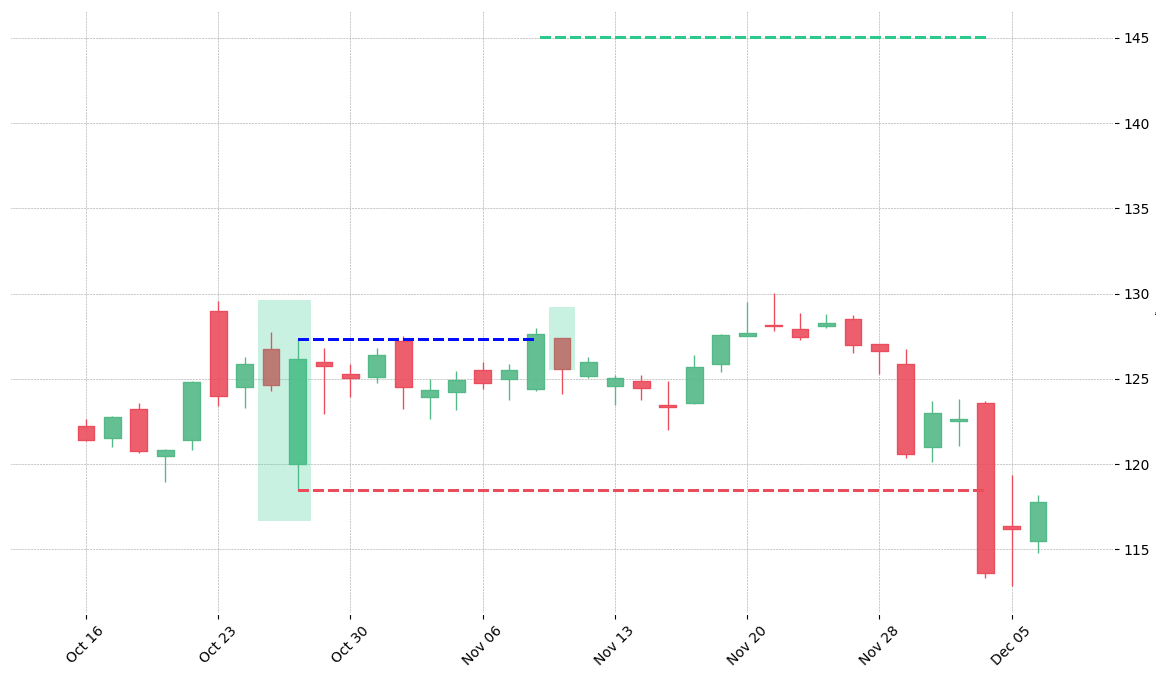
The stock NOW printed a bullish Piercing on 2017-10-25. It confirmed on 2017-11-08 (meaning price closed above entry level). It retested the trade entry level on 2017-11-09. Then it failed to reach the 2:1 R/R target and got stopped on 2017-12-04.
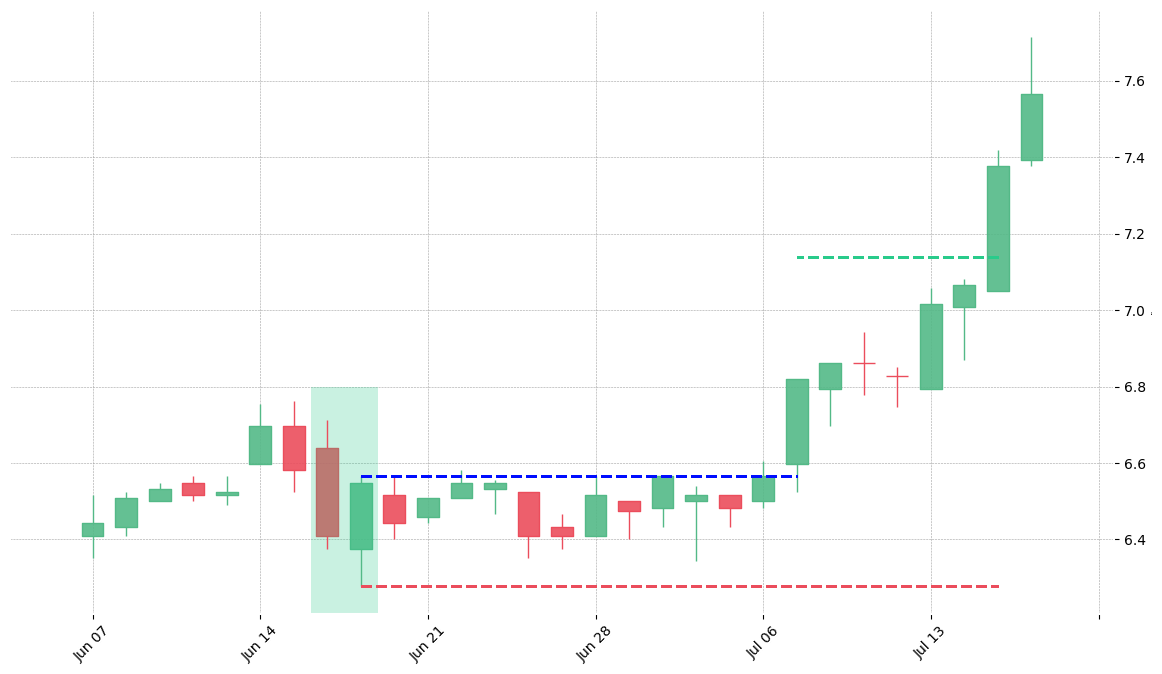
The stock HRB printed a bullish Piercing on 1999-06-16. It confirmed on 1999-07-07 (meaning price closed above entry level). It retested the trade entry level on 1999-09-01. Then it successfully reached the 2:1 R/R target.
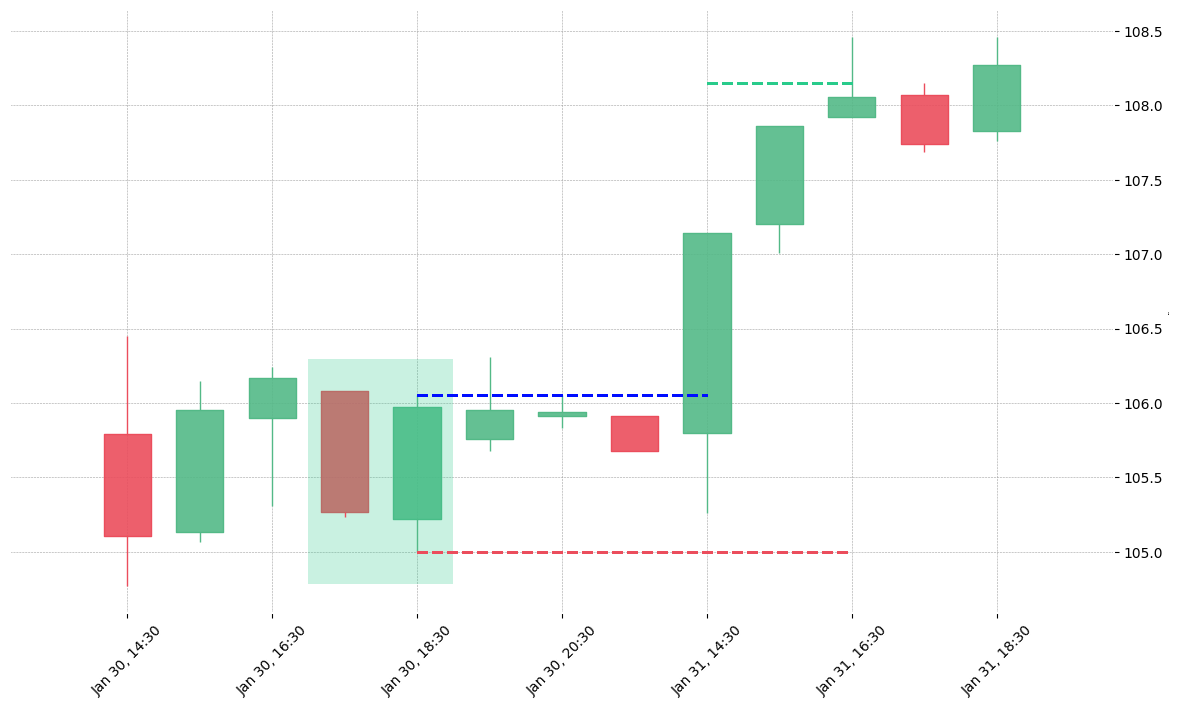
The stock WST printed a bullish Piercing on 2019-01-30 17:30:00. It confirmed on 2019-01-31 14:30:00 (meaning price closed above entry level). It retested the trade entry level on 2019-02-01 17:30:00. Then it successfully reached the 2:1 R/R target.
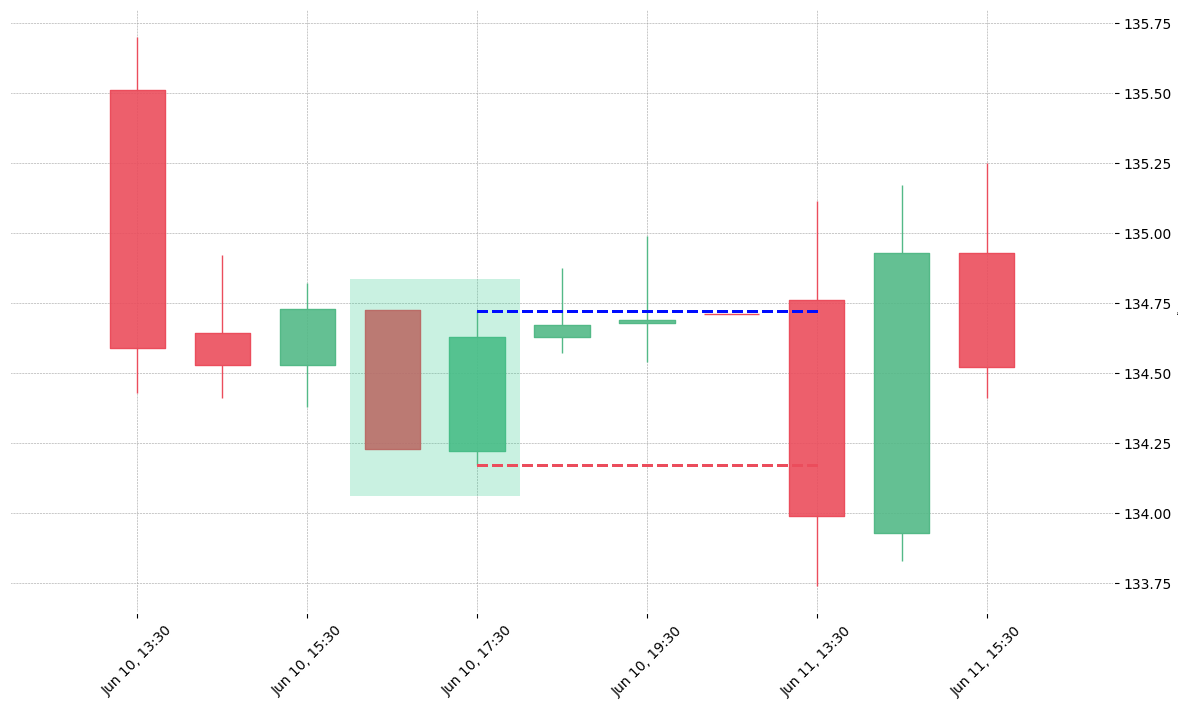
The stock CCI printed a bullish Piercing on 2019-06-10 16:30:00. Unfortunately it invalidated on 2019-06-11 13:30:00 before the trade could trigger (it triggered the stop before entering).
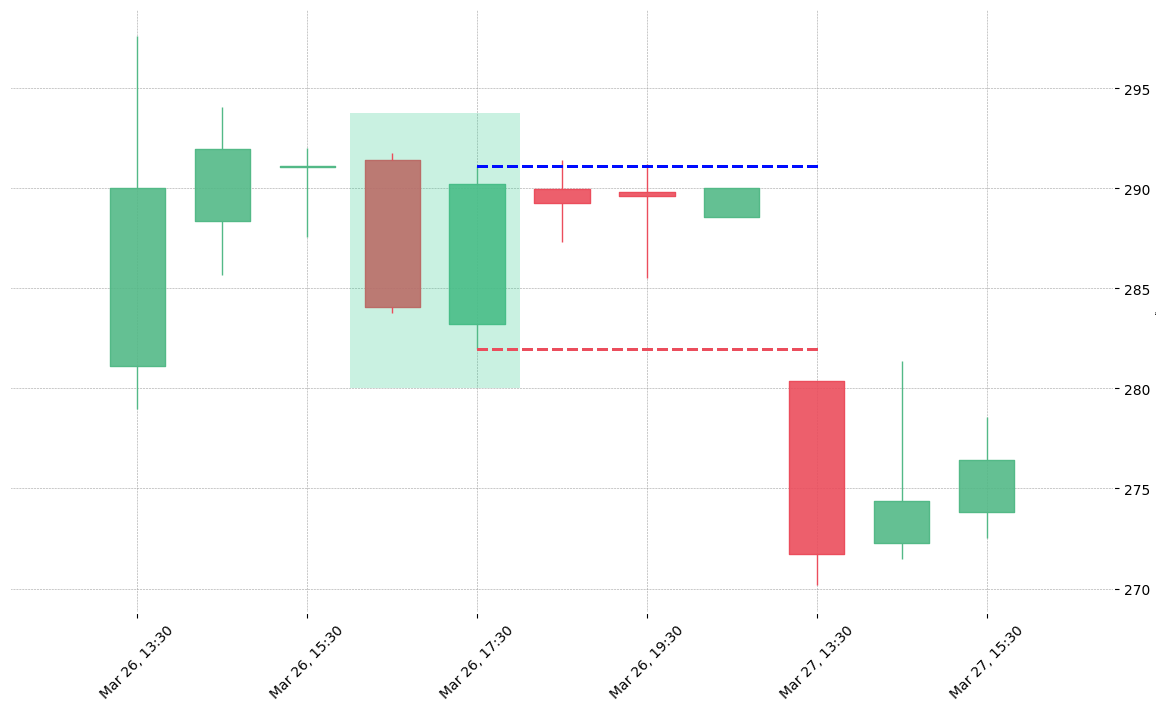
The stock TFX printed a bullish Piercing on 2020-03-26 16:30:00. Unfortunately it invalidated on 2020-03-27 13:30:00 before the trade could trigger (it triggered the stop before entering).

Looking to learn more about this pattern?
You should take a look at Joe Marwood's online course. In his course, he backtested the 26 main candlestick patterns before to summarize which one is THE best pattern. I really liked his course and you shouldn't miss it!
Click here to signup to his "Candlestick Analysis For Professional Traders" course now!
PS: Save 20% with the SAVE20 code.

Related articles you will like

Get “Every Candlestick Patterns Statistics”, The Last Trading Book You’ll Ever Need! 

© PatternsWizard | Crafted with care by traders for traders

Trading is not appropriate for all investors, and the risks can be substantial. You agree and acknowledge further that the trading signals and contents provided to you by PatternsWizard are not, and are not intended to be, an offer or solicitation to enter into any transaction, or any type of trading or investment advice, recommendation or strategy. You acknowledge that it is solely your decision to determine which, if any, PatternsWizard trading signals and contents to use for trading (whether actual or simulated). Statistics provided are the result of backtests and are provided as is with no guarantee. Past performance is no guarantee of future results. Trading PatternsWizard signals may result in losses. Leverage can work against you as well as for you, and can lead to large losses as well as gains. You should only trade with funds that you can afford to lose. Based on the foregoing, you agree that you shall not seek to hold PatternsWizard, its managers or its developpers responsible for any losses associated with any trading signals or contents provided to you by PatternsWizard. CFDs are complex instruments and come with a high risk of losing money rapidly due to leverage. Between 74-89 % of retail investor accounts lose money when trading CFDs. You should consider whether you understand how CFDs work and whether you can afford to take the high risk of losing your money. PatternsWizard is for education purposes only.
Some of the links in this site are affiliate links. It means these websites will pay us a small commission at no additional cost to you if you buy from them.
PatternsWizard is NOT FINANCIAL ADVICE, trade responsibly.