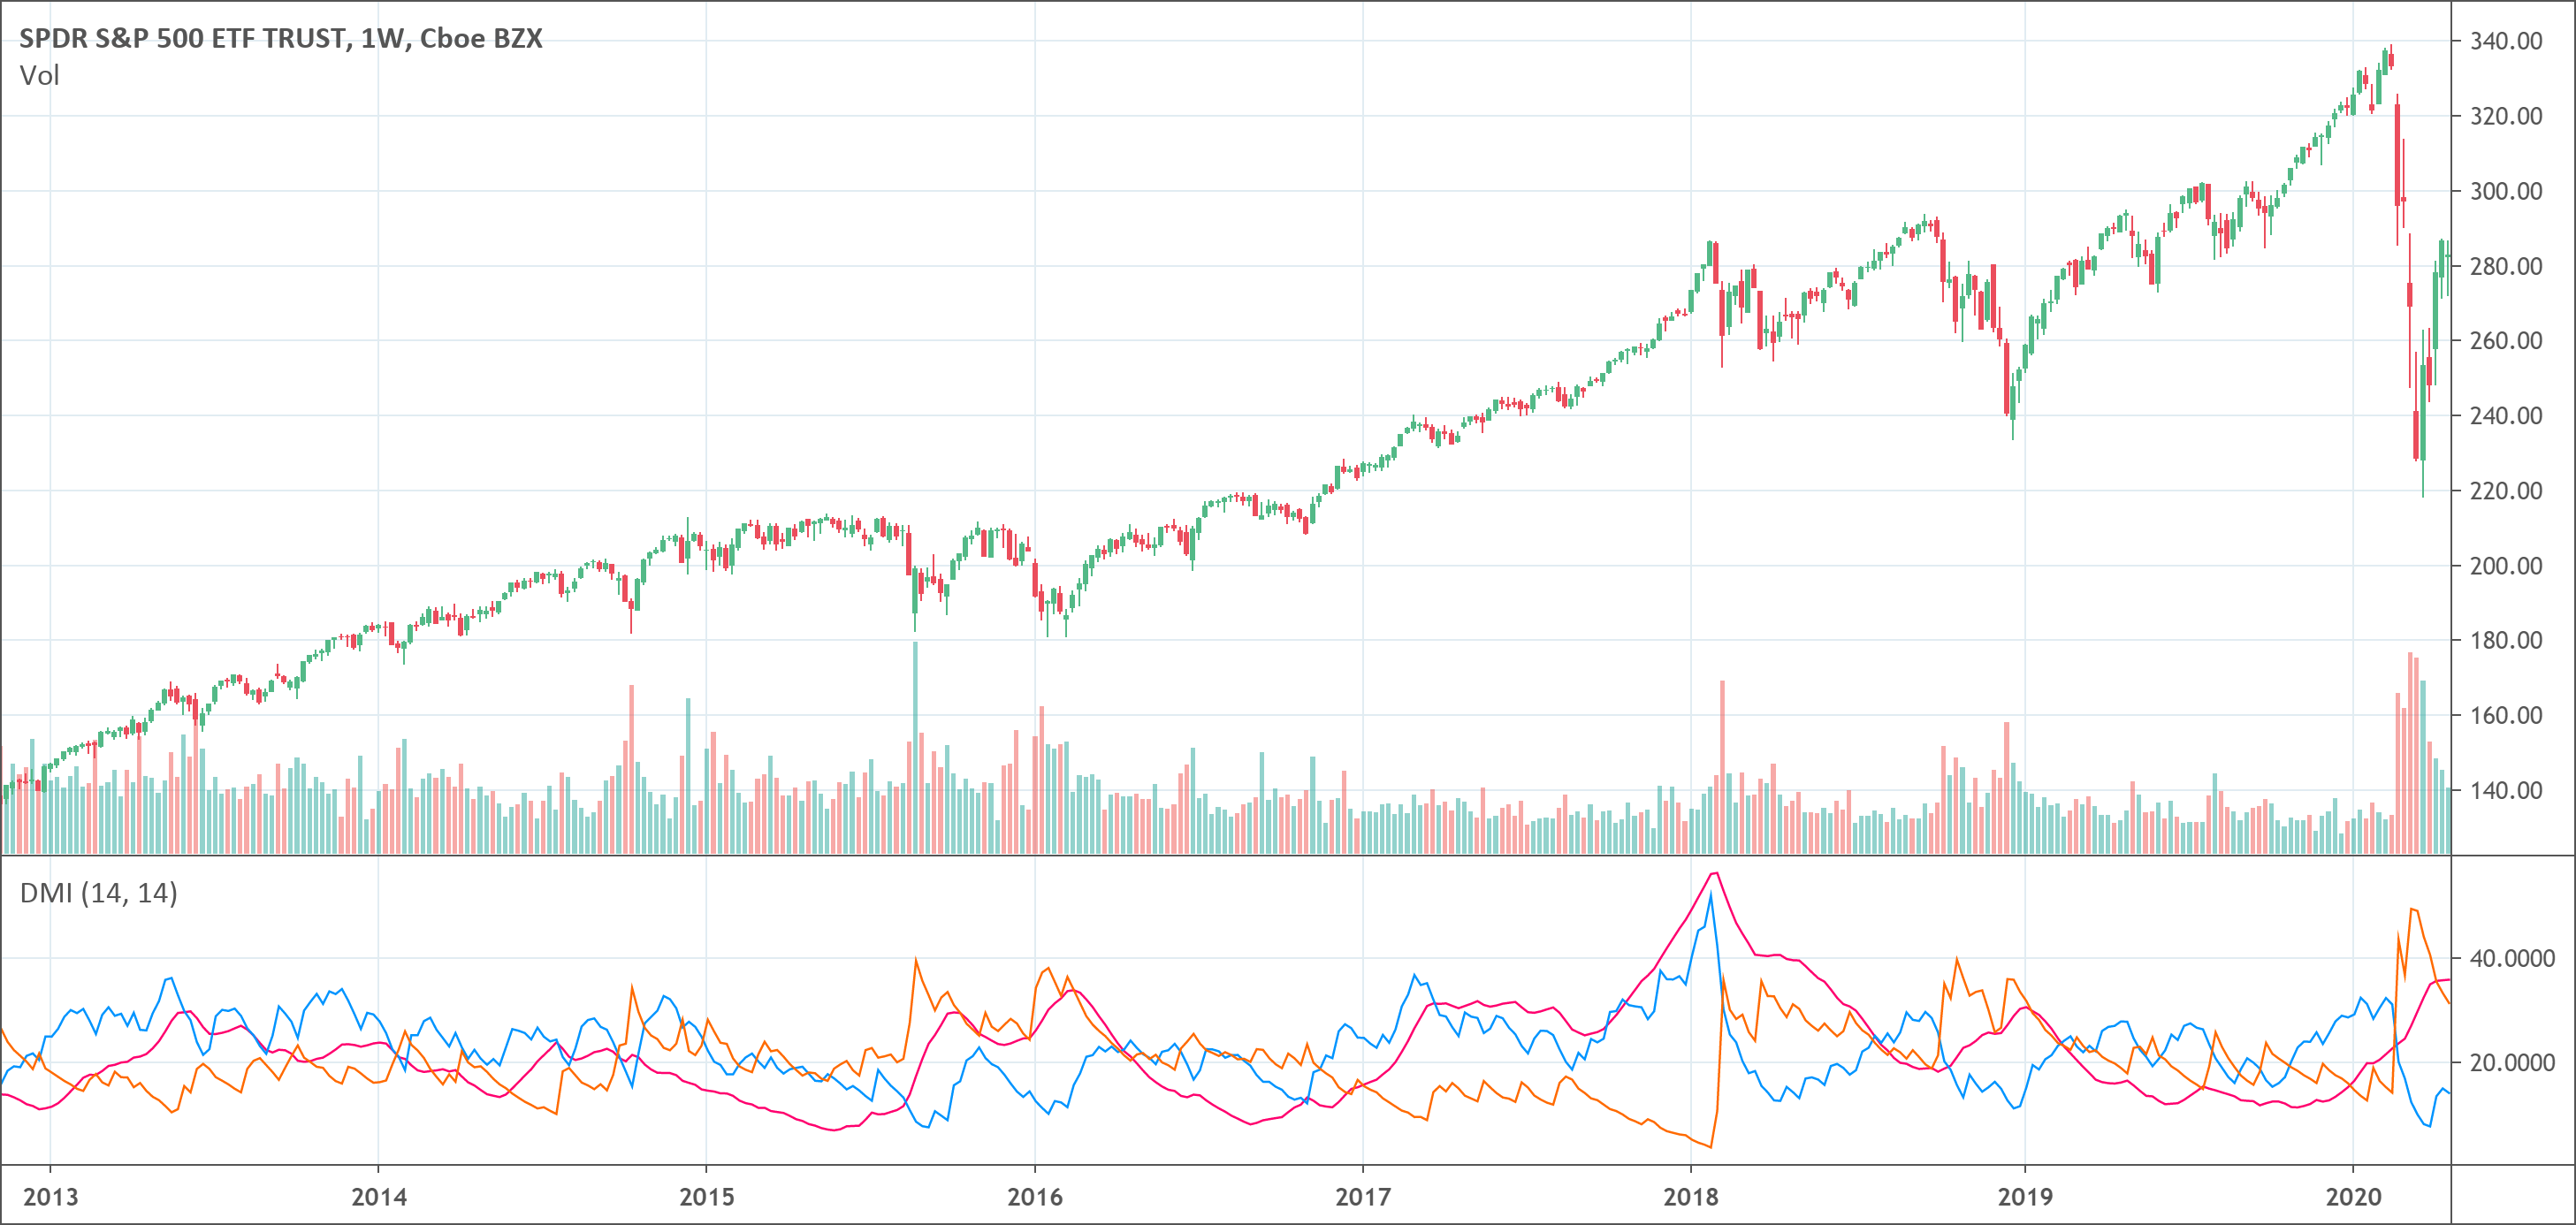
Directional Movement Index (DMI) Indicator
The Directional Movement Index (DMI) is composed of 2+1 lines The -DI line shows the selling pressure (-DI), The +DI line shows the buying pressure And the DX line shows … Read more

Indicators are useful tools to help traders measure trend direction, strength, volatility. Is the volume supporting the trend? You can know with indicators.
The Directional Movement Index (DMI) is composed of 2+1 lines The -DI line shows the selling pressure (-DI), The +DI line shows the buying pressure And the DX line shows … Read more
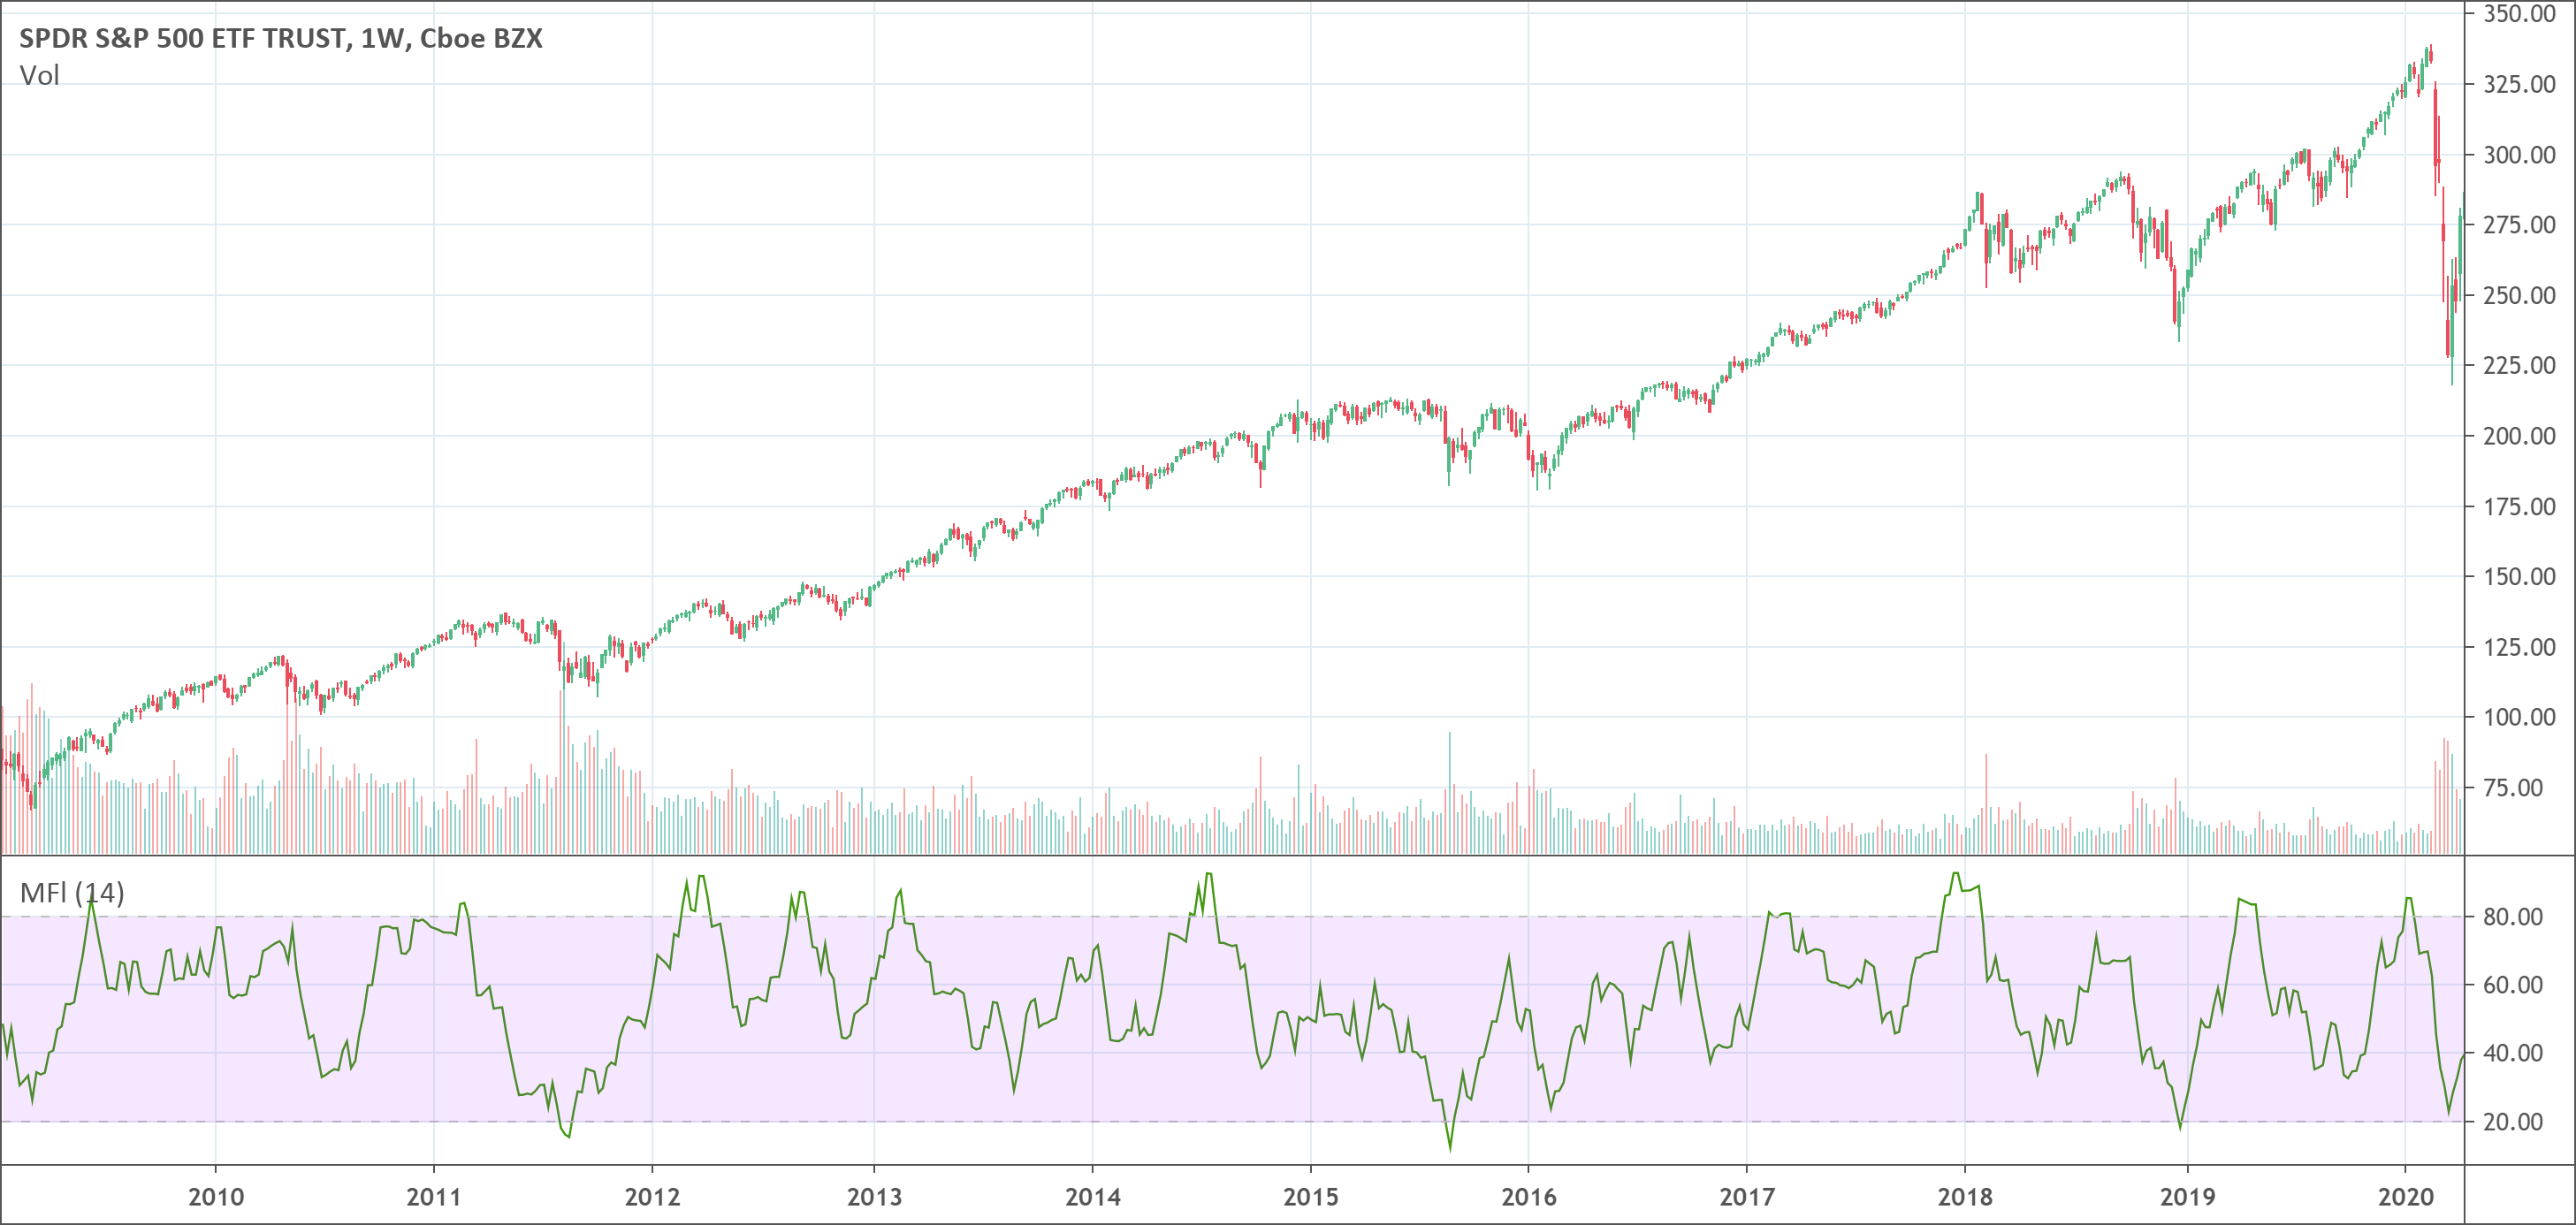
The Money Flow Index (MFI) indicator is a momentum indicator. When MFI is above 80, the market is considered overbought. When MFI is below 20, the market is considered oversold. … Read more
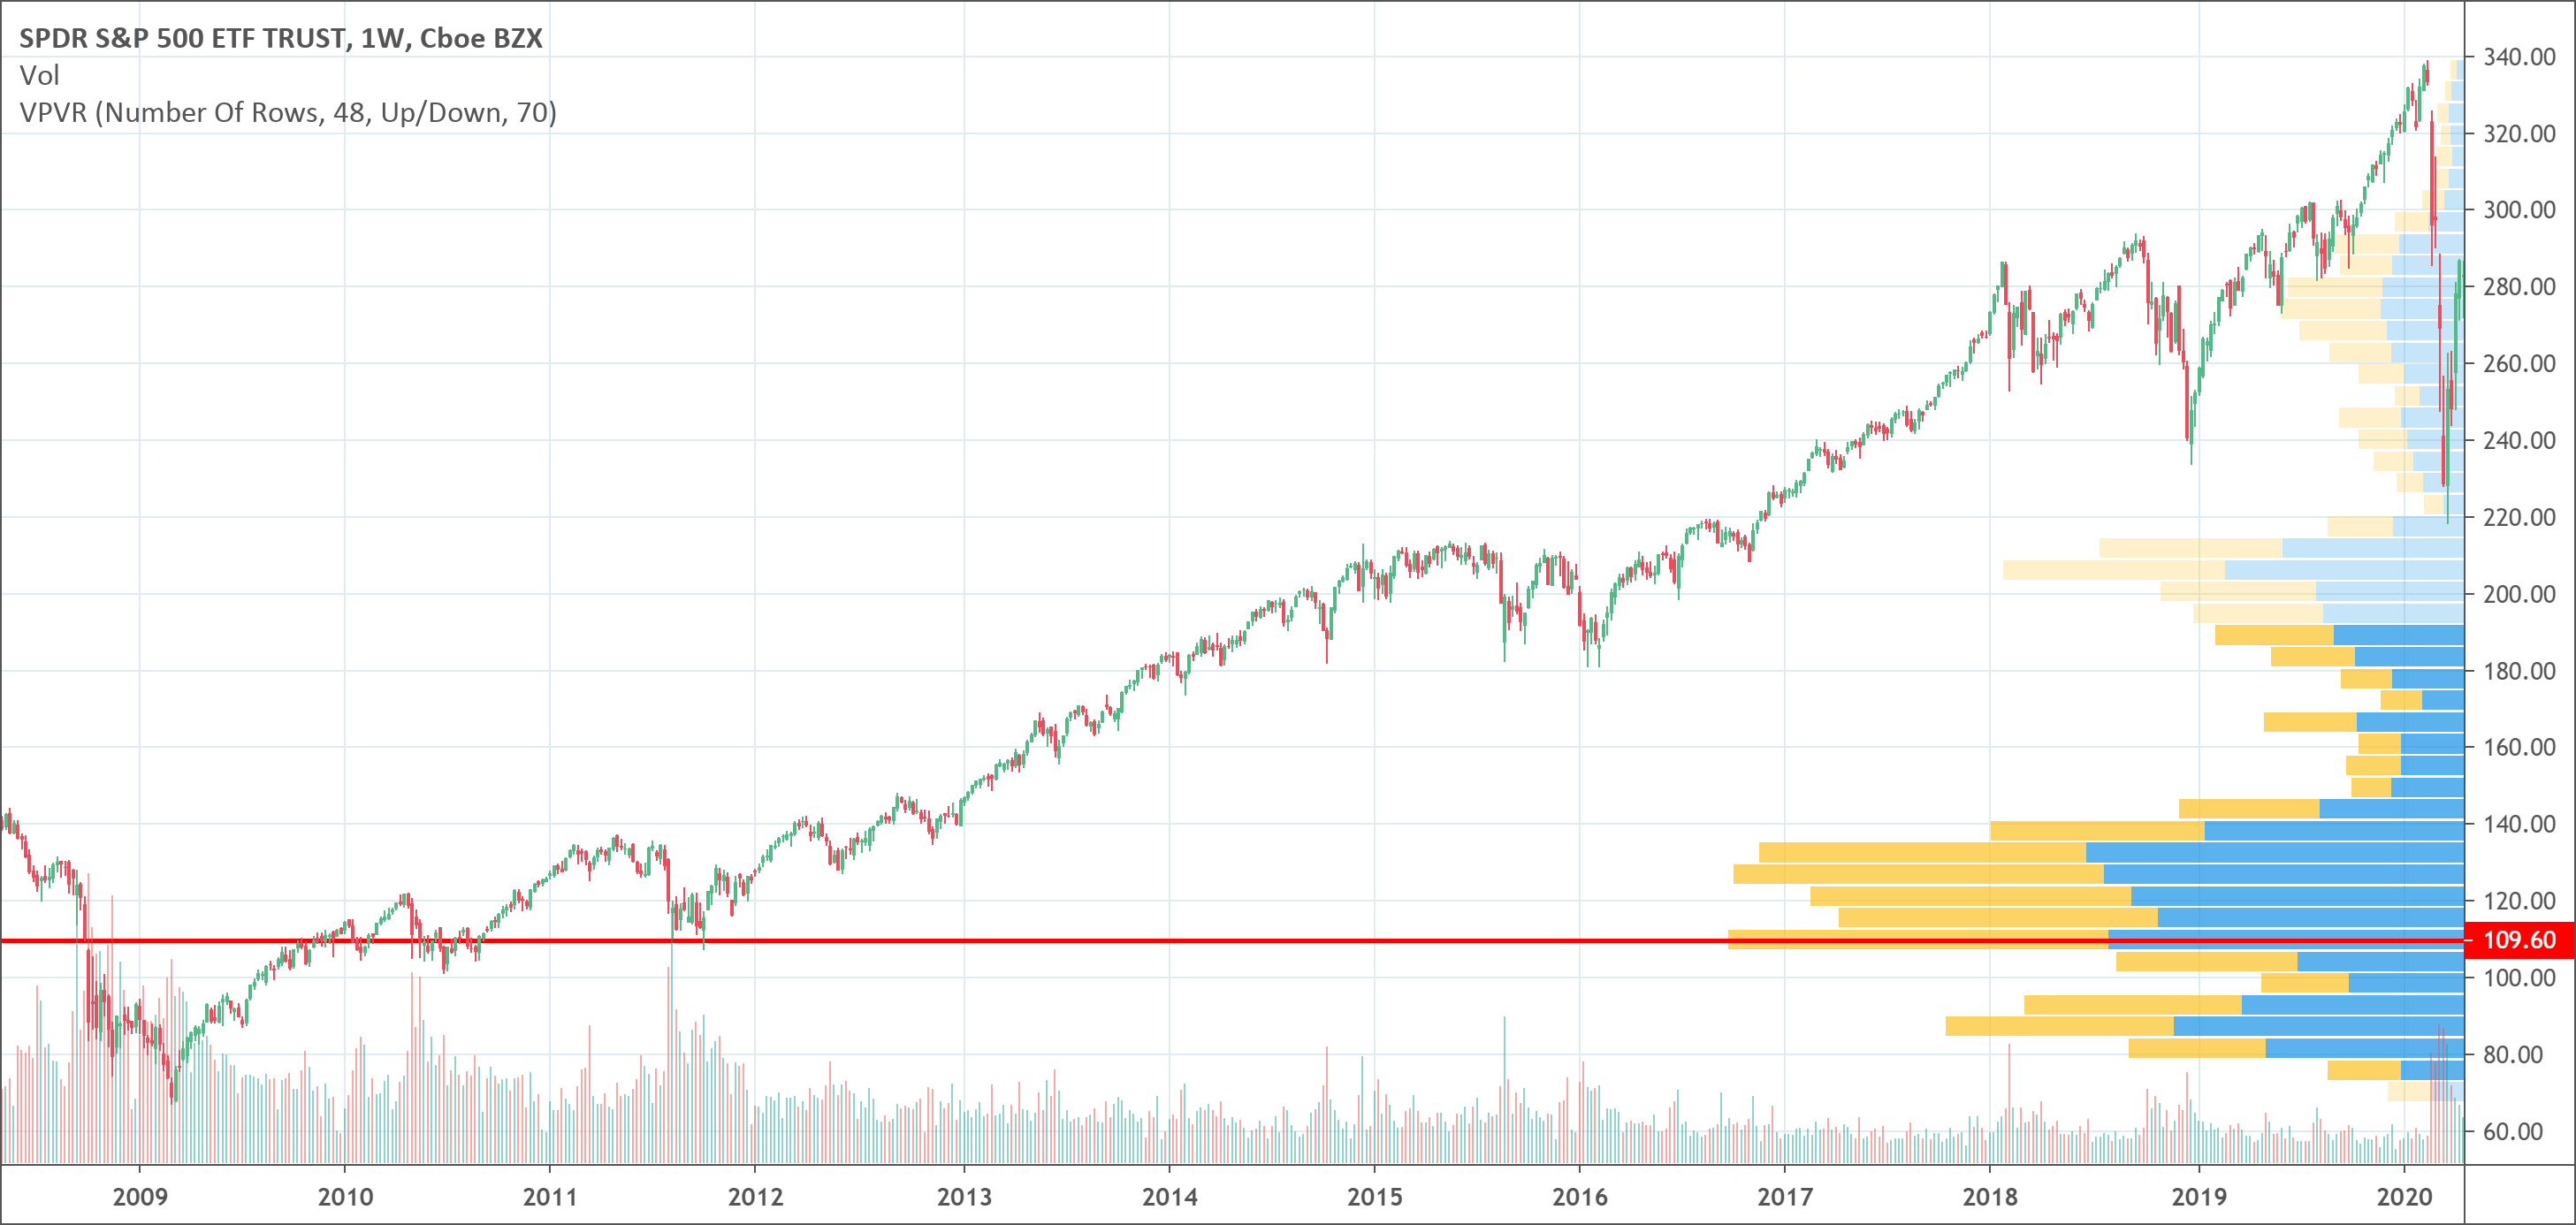
Volume Profile shows the price where the security was most traded. It takes a given range for computation (either visible or fixed). The more volume traded at a given price, … Read more
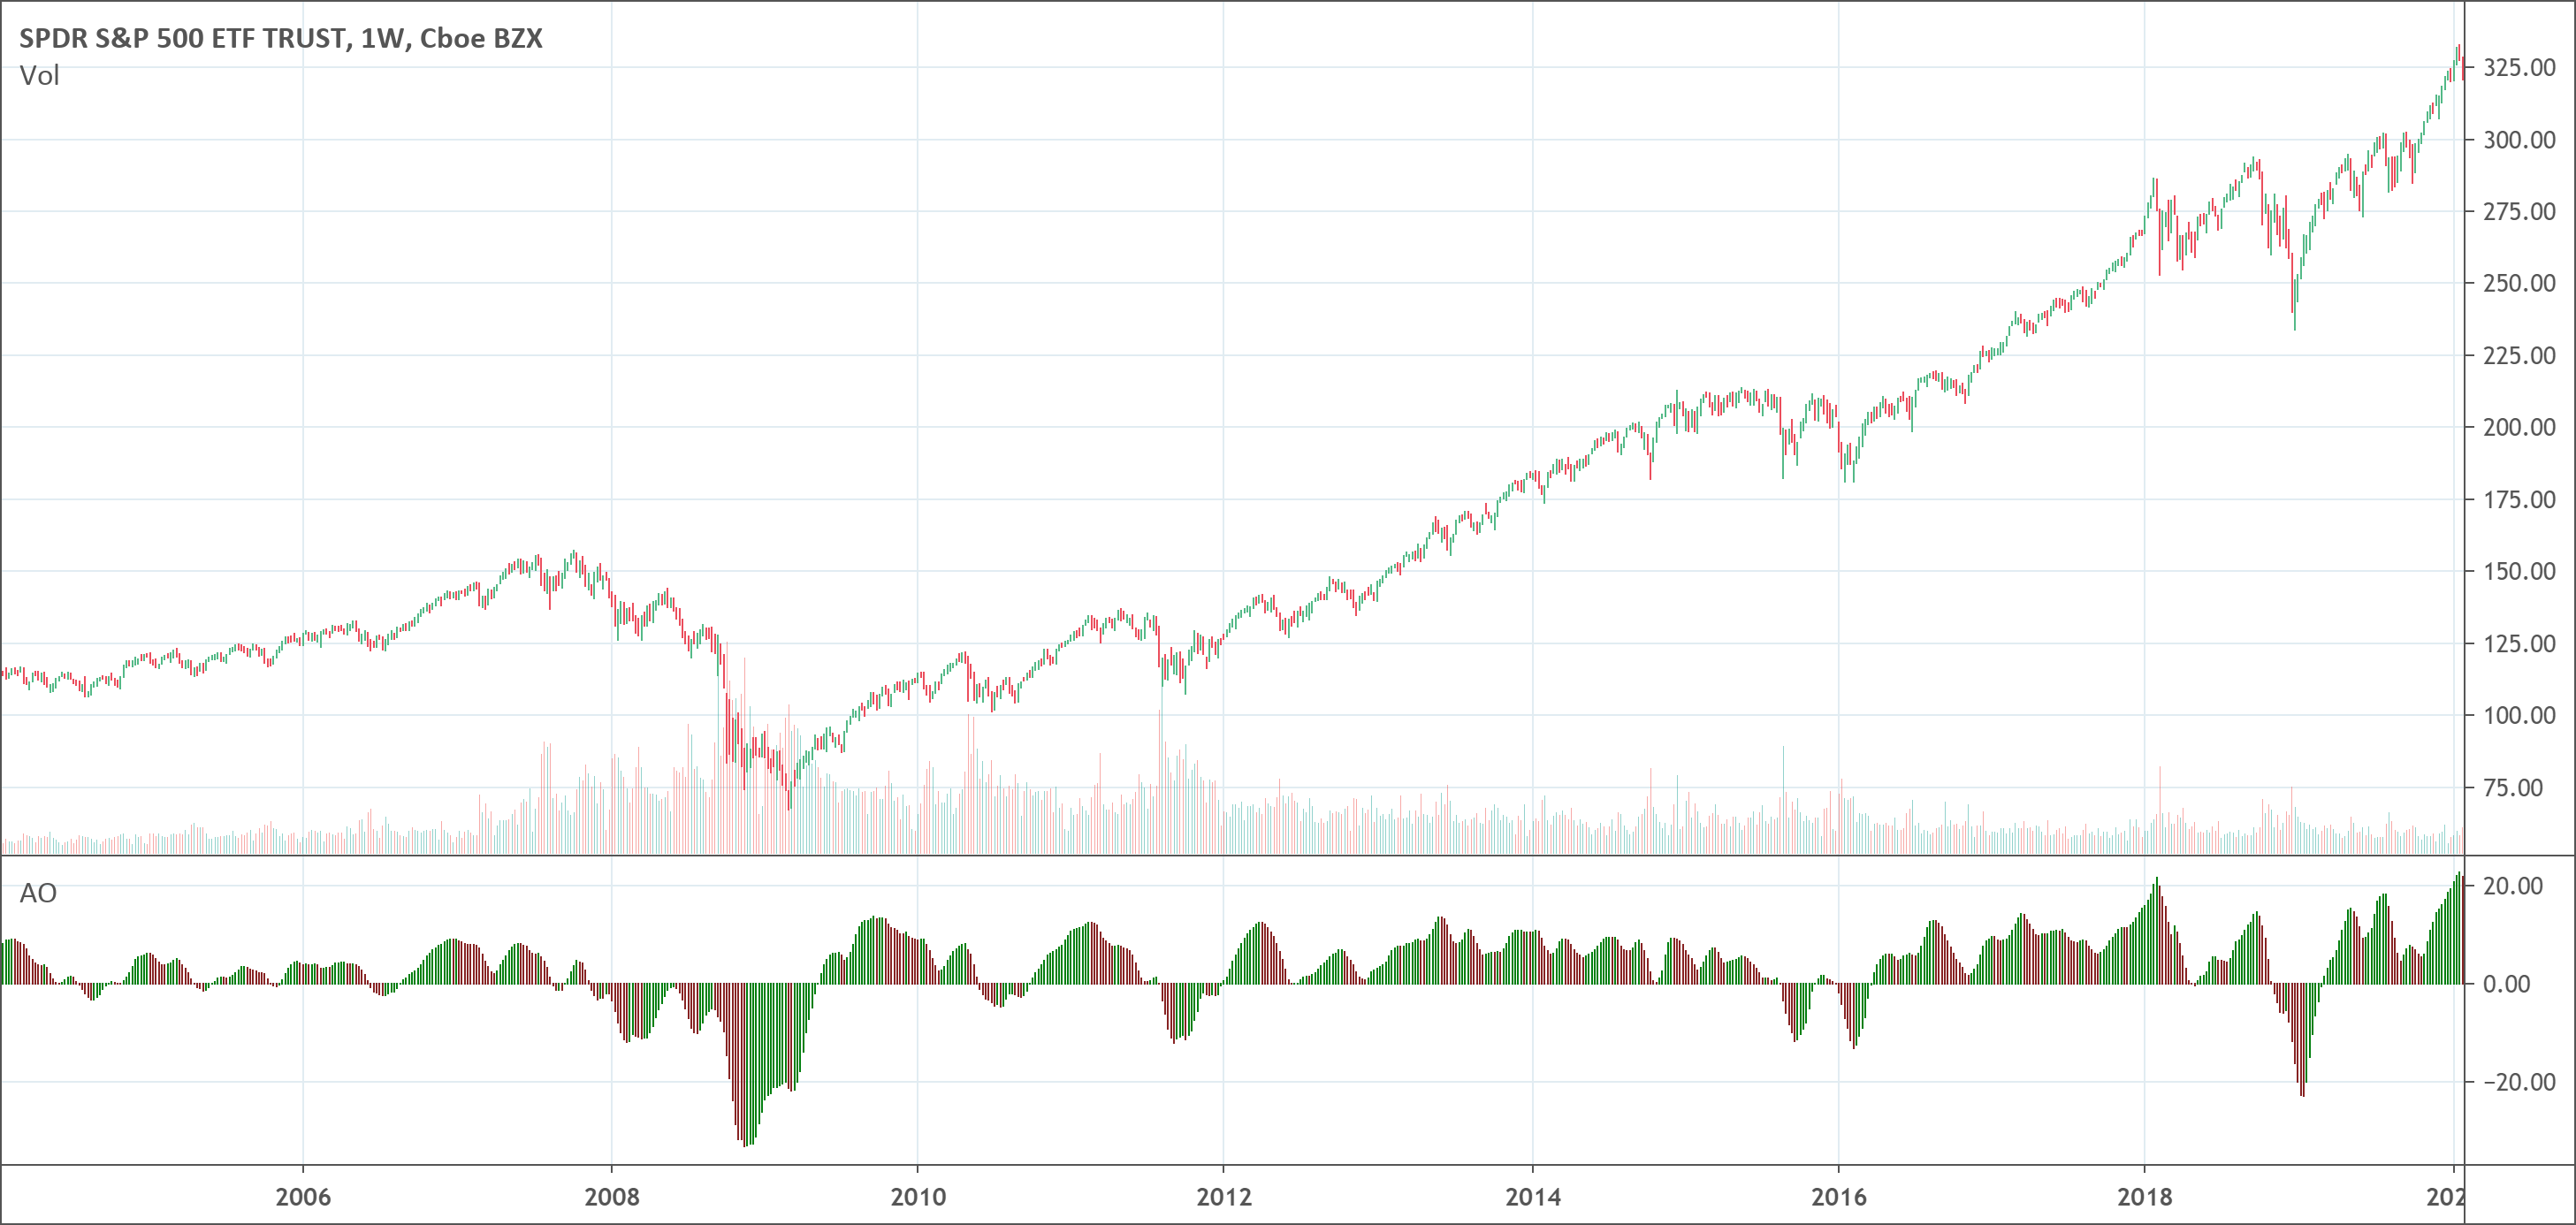
The legendary chartist, Bill Williams created the Awesome Oscillator indicator. He showed it as the best momentum indicator that is as simple as it is elegant. Traders use it to … Read more
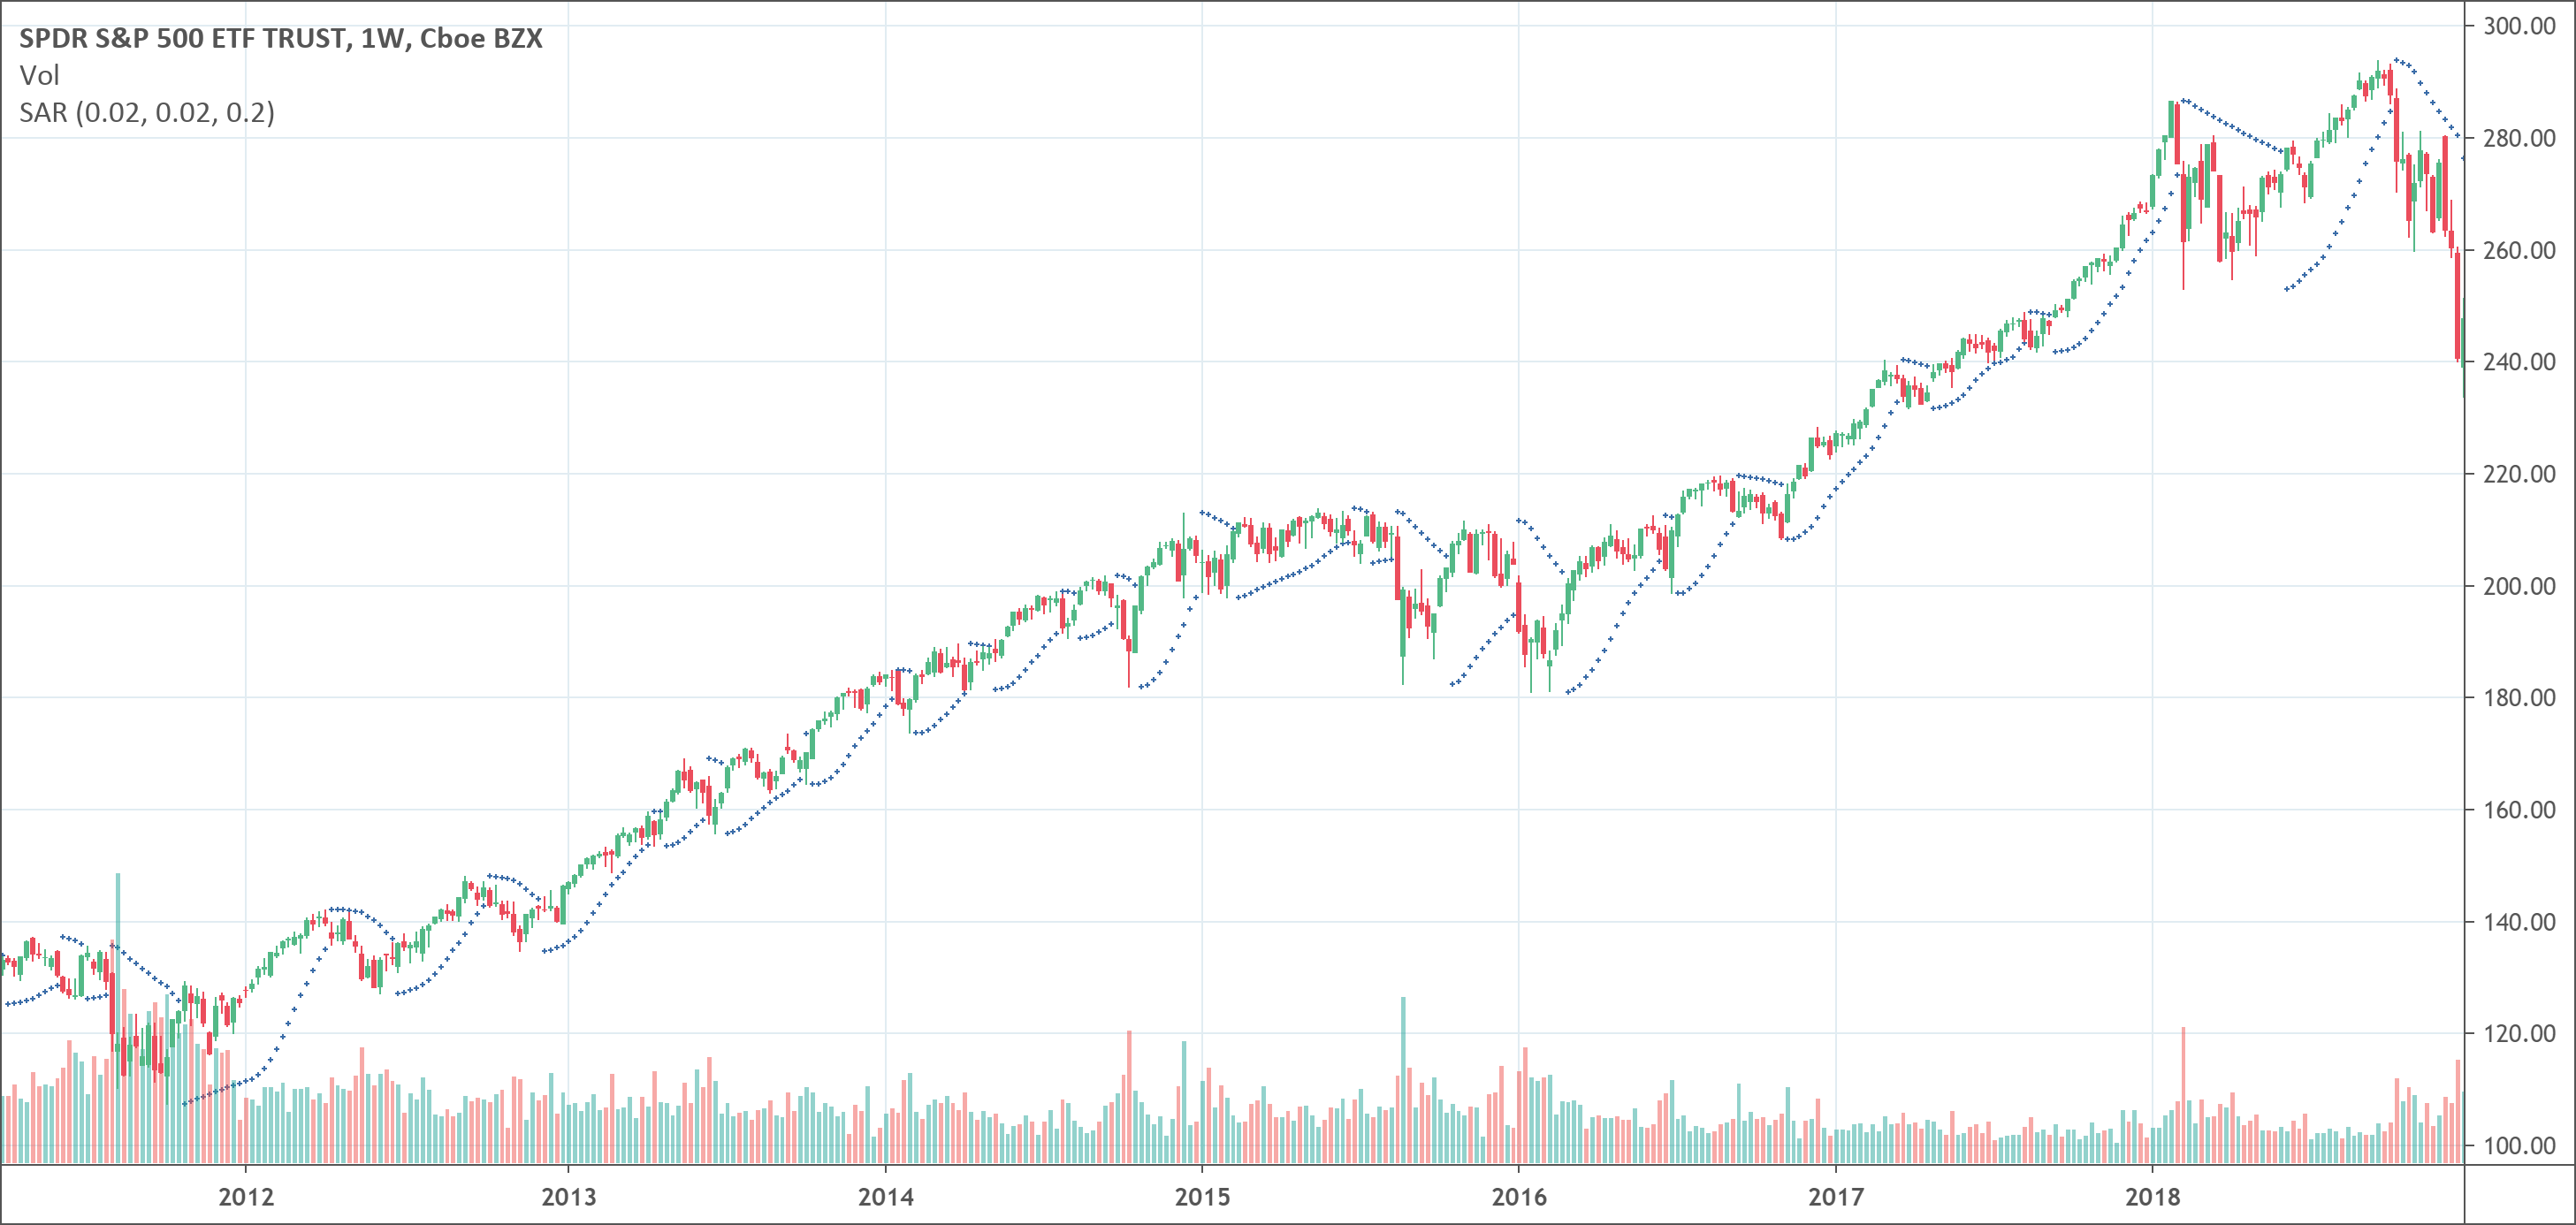
The Parabolic SAR indicator helps traders spot trend direction and potential reversals. It appears on charts as a series of dots/cross above (when price is going down) or below (when … Read more
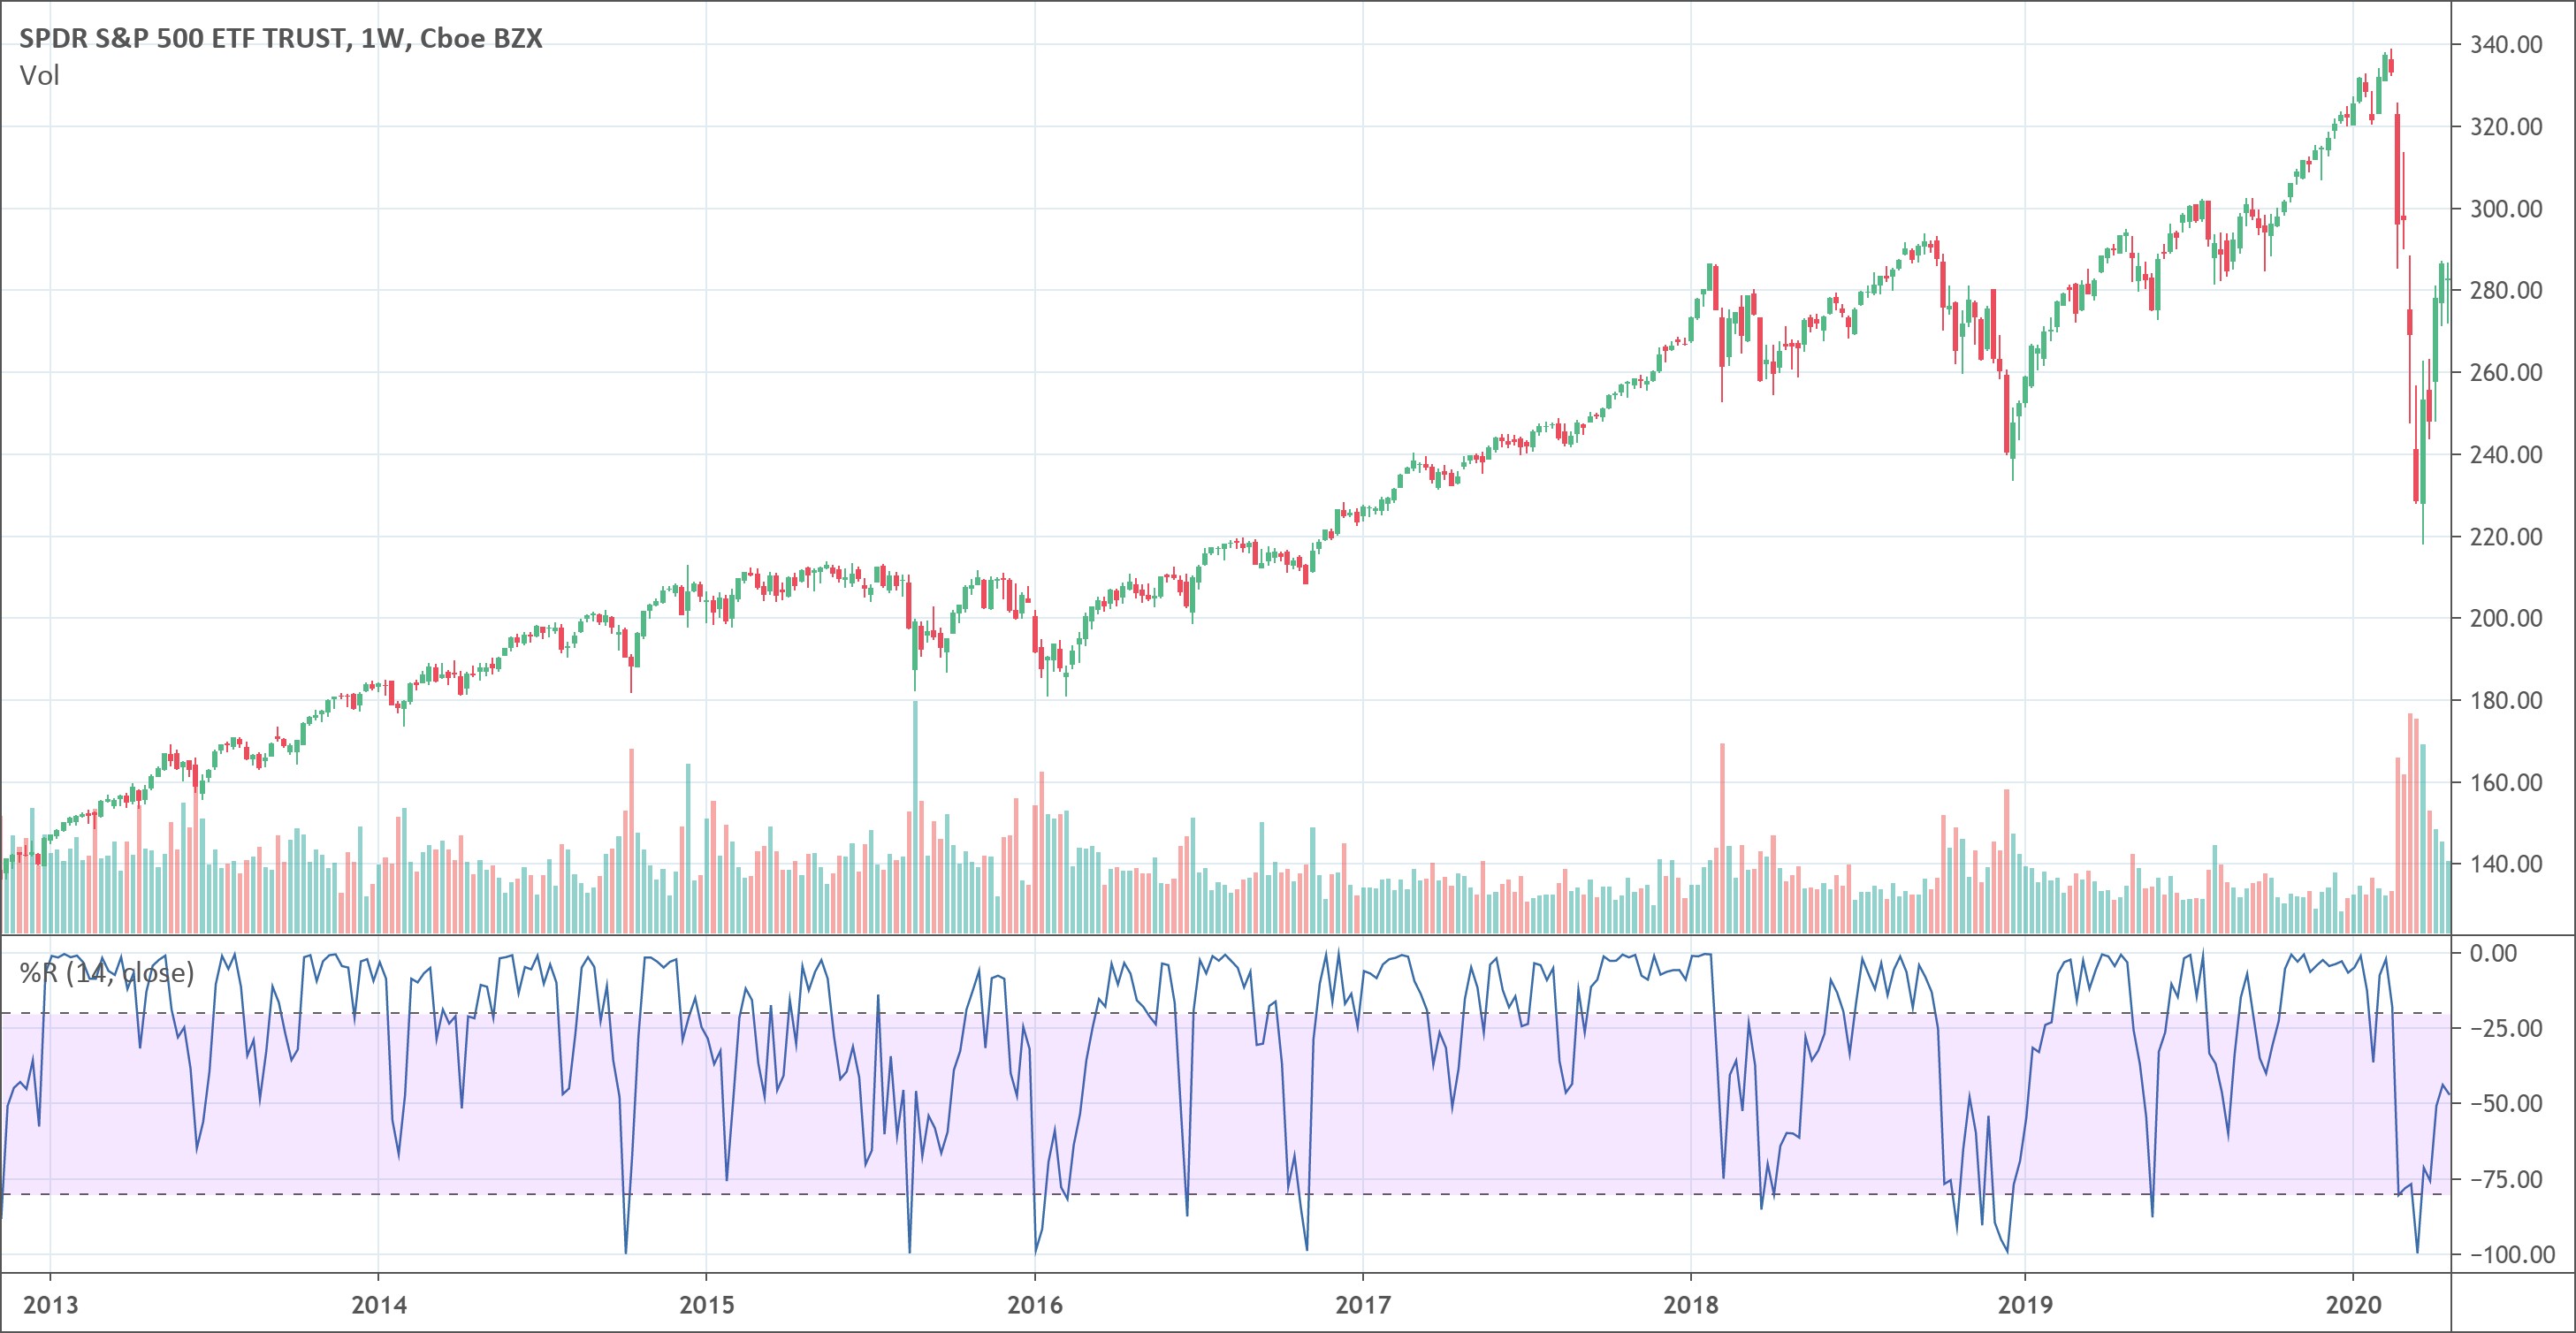
The Williams %R indicator oscillates between 0 and -100. When its value is above -20, it sends an overbought signal. When its value is below -80, it sends an oversold … Read more
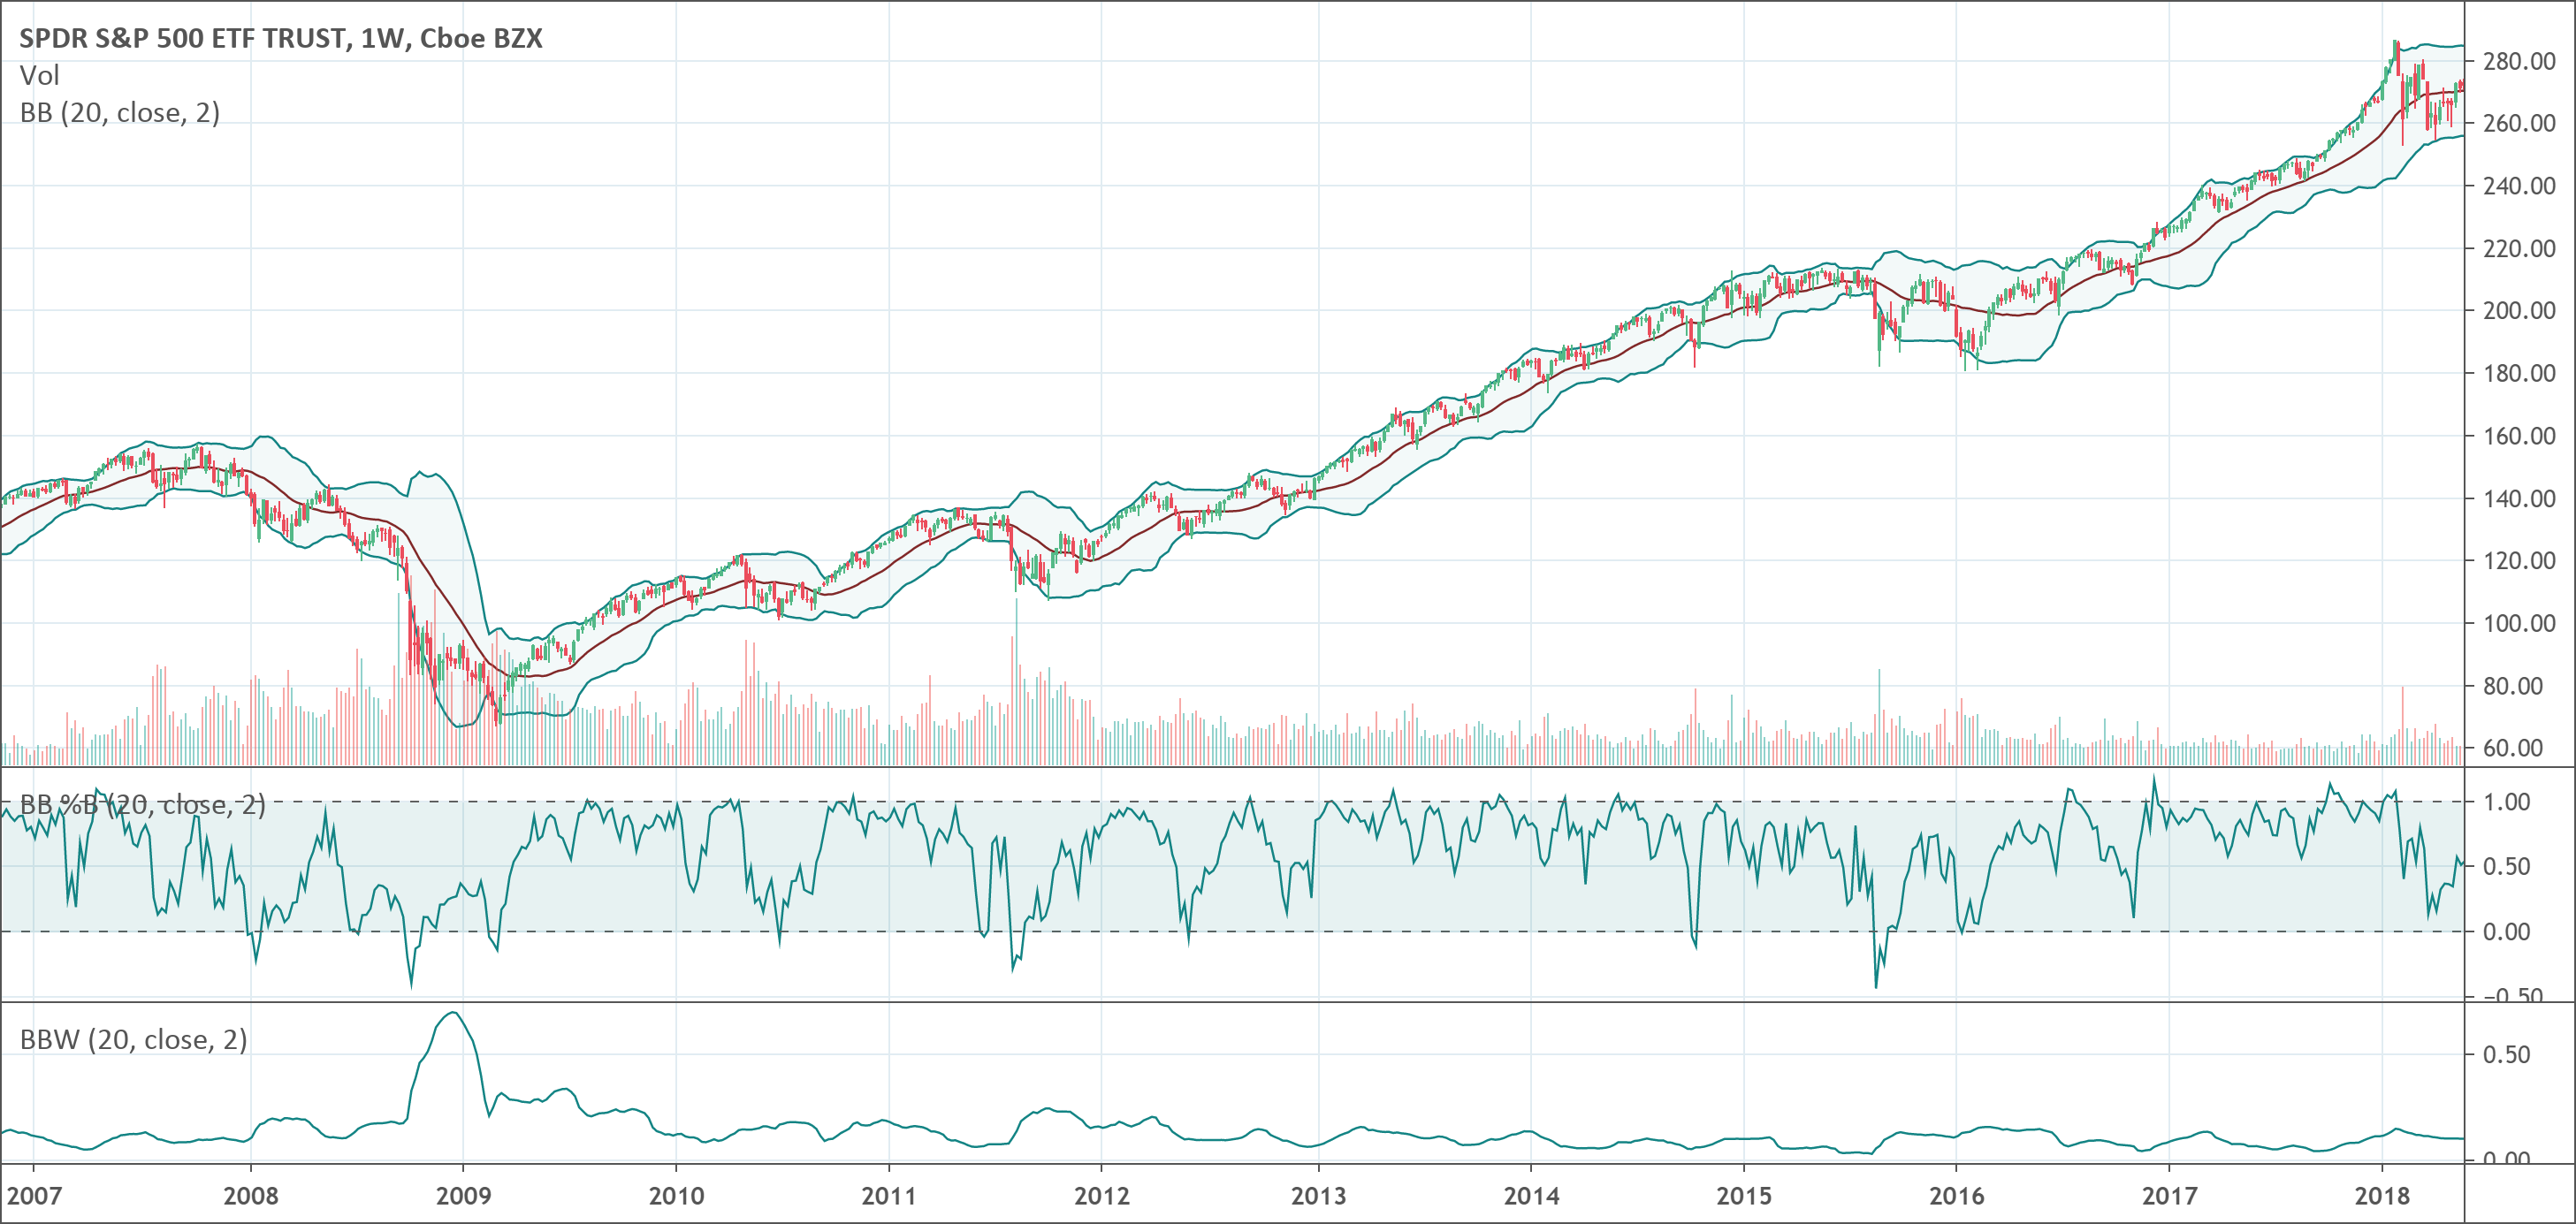
John Bollinger created the technique of using a moving average with two trading bands below and above it. He introduced this technique in the 1980s and he trademarked this term … Read more
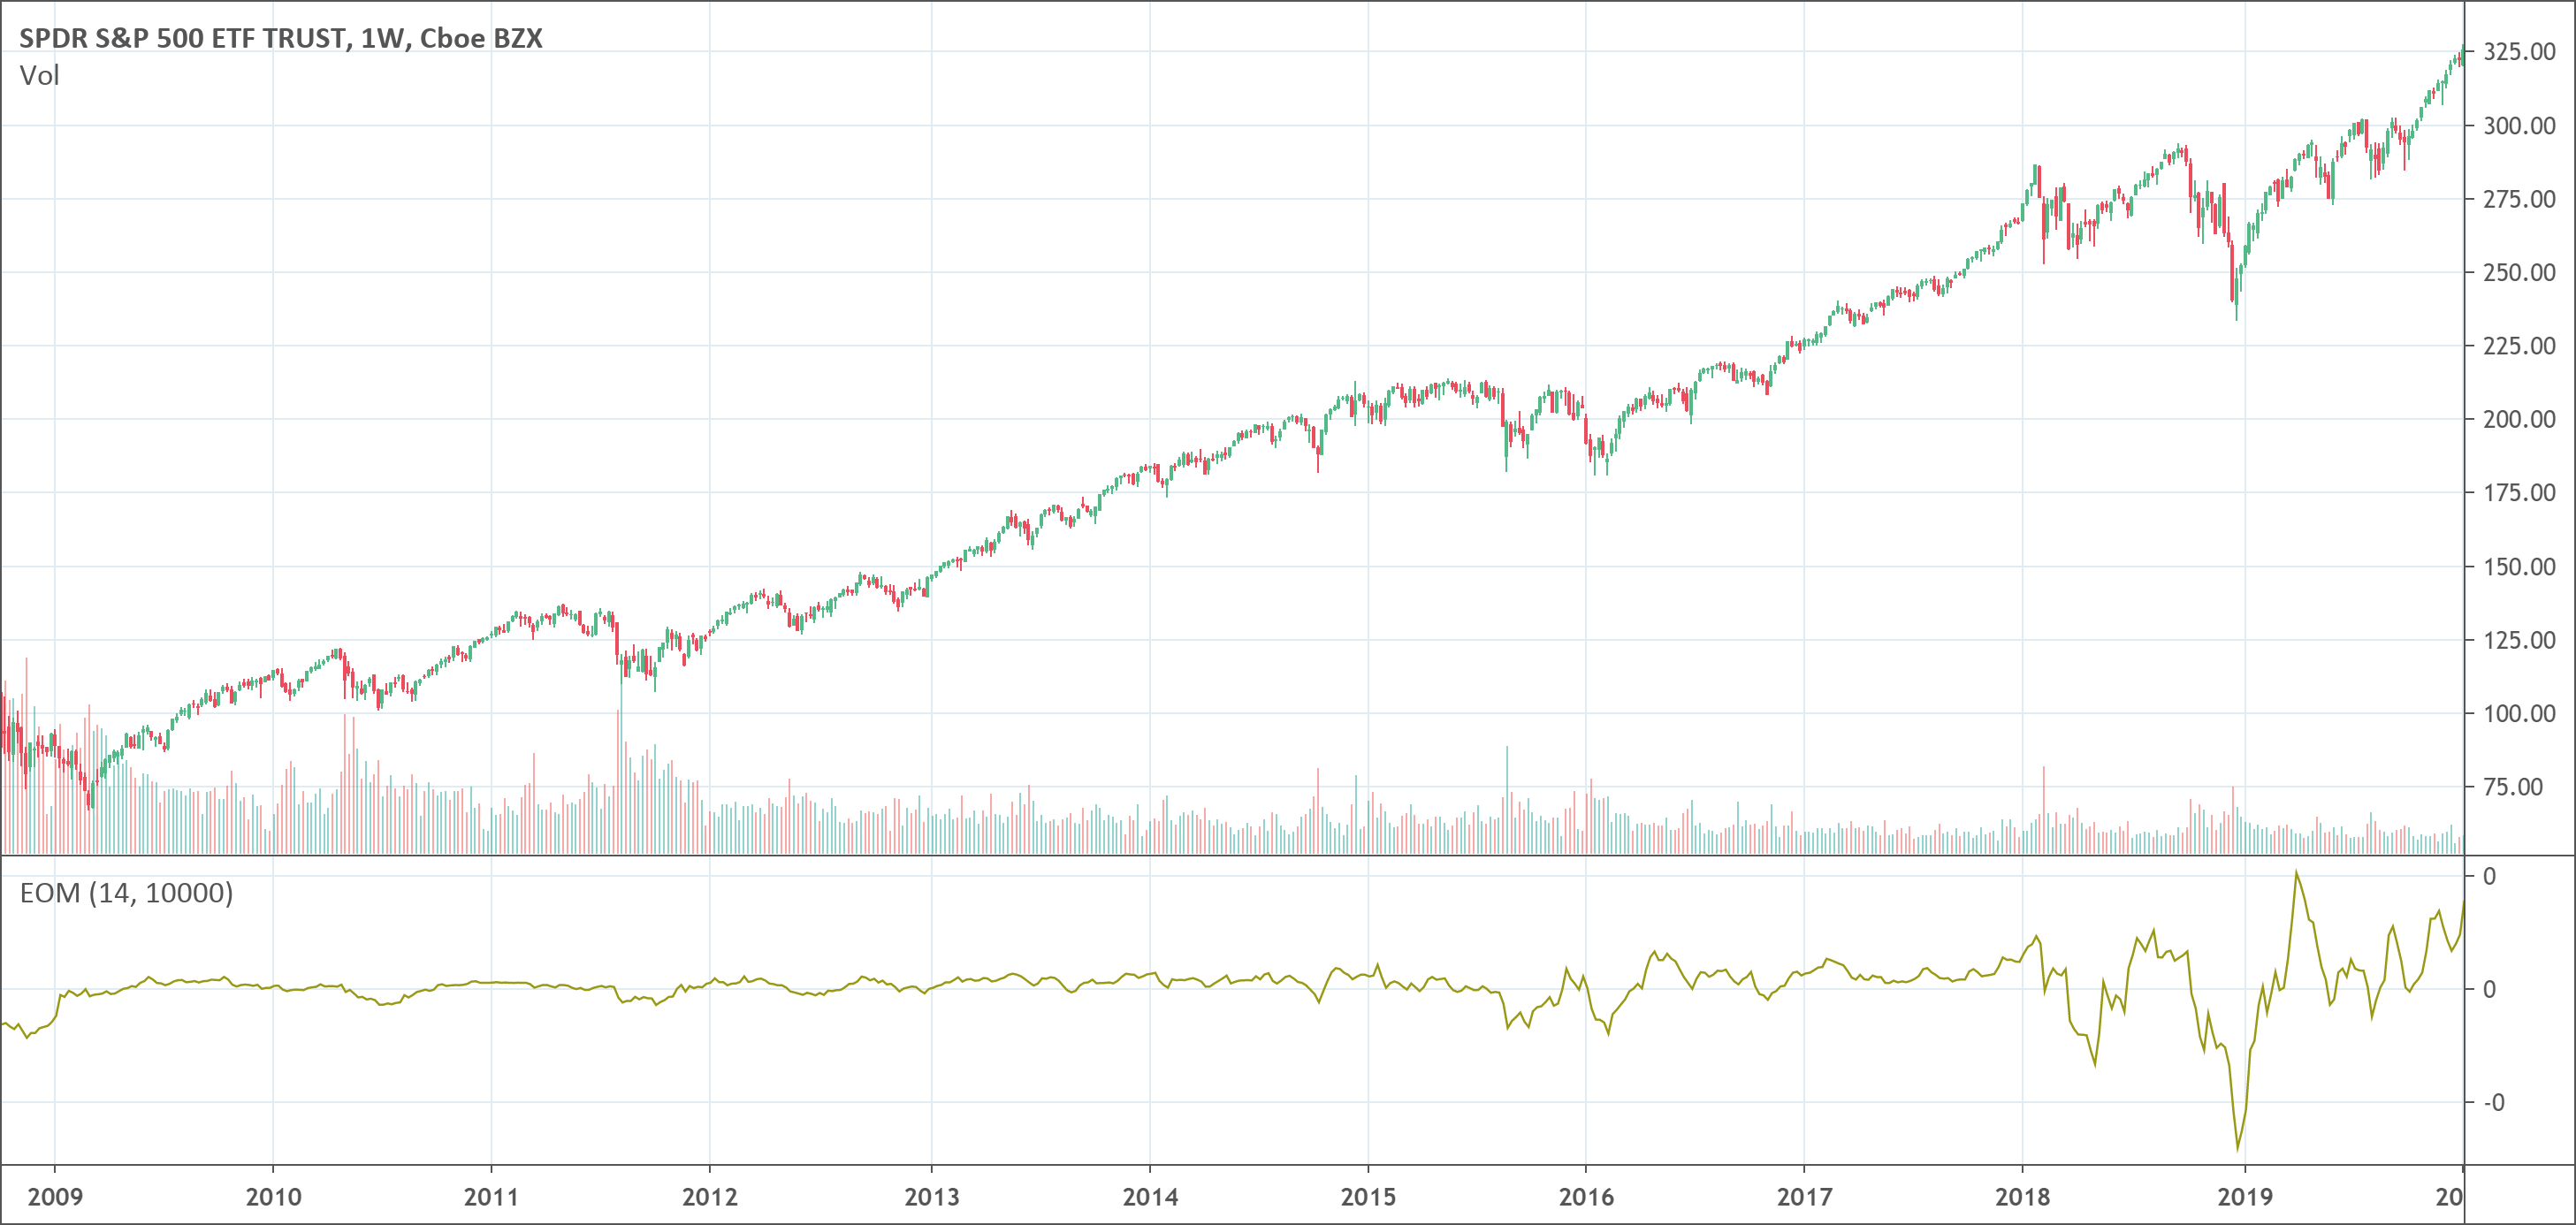
Ease of movement (EMV) momentum indicator shows the link between the rate of change in the price of an asset and its volume. It is best to use it for … Read more
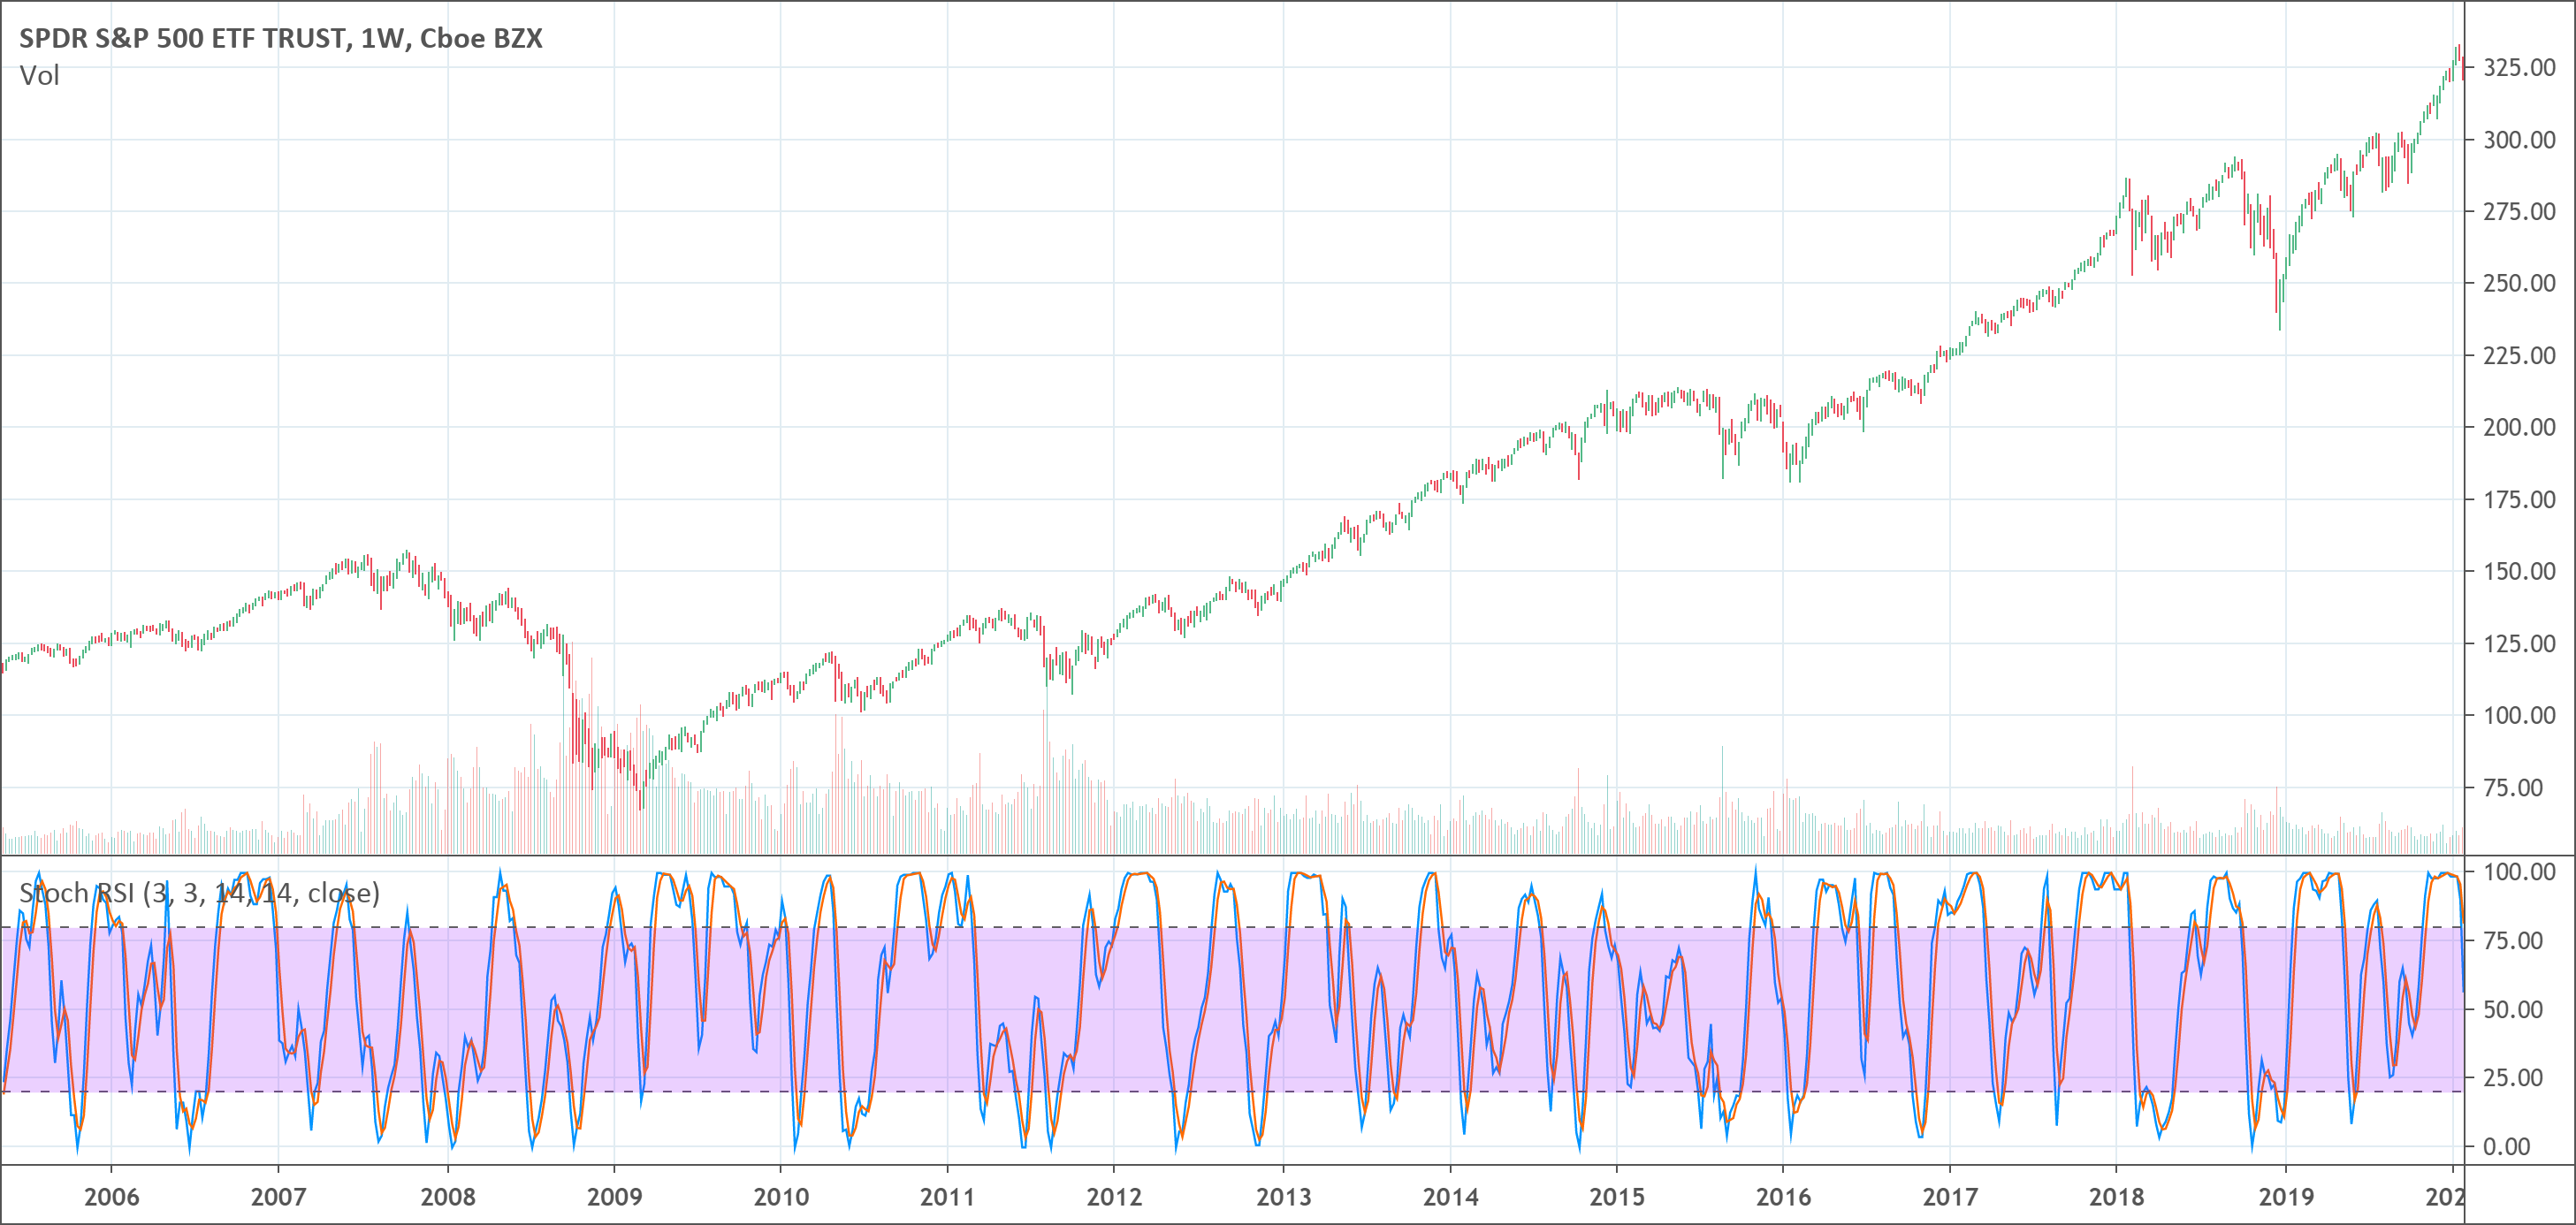
The oscillator helps trader take advantage of both momentum indicators to make another indicator. The new indicator is more sensitive and synchronises well to the historical performance of a particular … Read more
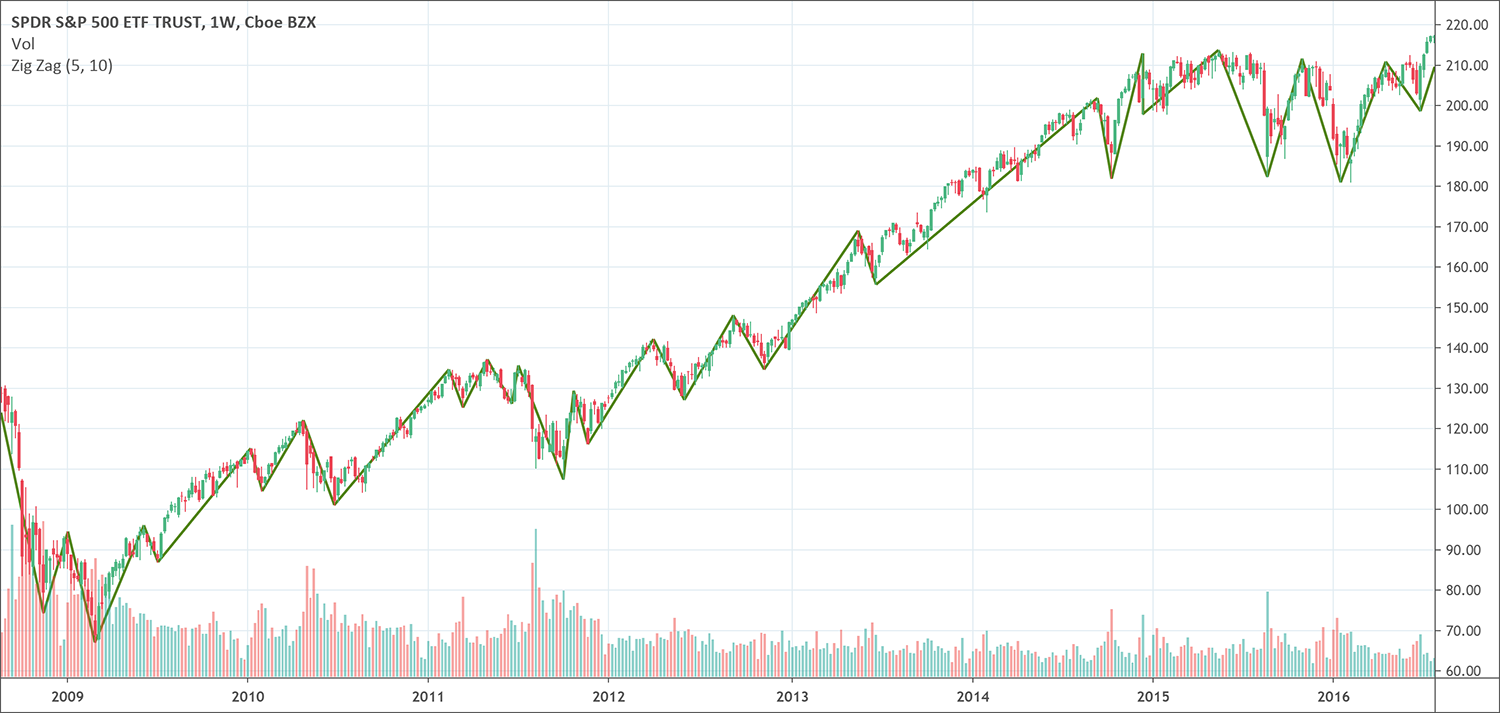
The Zig Zag indicator helps traders reduce market noise. It highlights underlying trends with its higher highs or lower lows. The indicator works best in strongly trending markets. What is … Read more
We research technical analysis patterns so you know exactly what works well for your favorite markets.
© PatternsWizard | Crafted with care by traders for traders
Trading is not appropriate for all investors, and the risks can be substantial. You agree and acknowledge further that the trading signals and contents provided to you by PatternsWizard are not, and are not intended to be, an offer or solicitation to enter into any transaction, or any type of trading or investment advice, recommendation or strategy. You acknowledge that it is solely your decision to determine which, if any, PatternsWizard trading signals and contents to use for trading (whether actual or simulated). Statistics provided are the result of backtests and are provided as is with no guarantee. Past performance is no guarantee of future results. Trading PatternsWizard signals may result in losses. Leverage can work against you as well as for you, and can lead to large losses as well as gains. You should only trade with funds that you can afford to lose. Based on the foregoing, you agree that you shall not seek to hold PatternsWizard, its managers or its developpers responsible for any losses associated with any trading signals or contents provided to you by PatternsWizard. CFDs are complex instruments and come with a high risk of losing money rapidly due to leverage. Between 74-89 % of retail investor accounts lose money when trading CFDs. You should consider whether you understand how CFDs work and whether you can afford to take the high risk of losing your money. PatternsWizard is for education purposes only.
Some of the links in this site are affiliate links. It means these websites will pay us a small commission at no additional cost to you if you buy from them.
PatternsWizard is NOT FINANCIAL ADVICE, trade responsibly.