
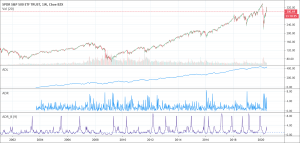
The accumulation distribution indicator (ADL) is a volume-measurement kind of indicator. It was created by a well-known trader and analyst, Marc Chaikin, as a stock selection tool. He has subsequently found broader application as a leading indicator for other markets, such as Forex.
Accumulation/distribution strategy tries to detect divergences in price and volume data. From this it offers advanced warning of future price movements.
An investor that is accumulating stock is simply purchasing stock. Also, an investor who is sharing stock to the market is selling. As a result of this, the accumulation/distribution indicator is, therefore, an attempt to size up demand and supply, which logically drives price movement.
- The accumulation/distribution line indicator helps traders gauges supply and demand.
- The A/D line’s slope helps confirm the trend. A rising A/D line votes for an uptrend where a falling A/D line votes for a downtrend.
- If the A/D line doesn’t move in the same direction than price, it creates a divergence which indicates weakness or strength.
What is the Accumulation/Distribution indicator?
Accumulation/distribution is a cumulative indicator. It makes use of volume and price to assess if a stock is being accumulated or distributed. The indicator seeks to identify divergences between the volume flow and stock price. This offers insight into how strong a trend is. If the price is increasing but the indicator is falling, this means that buying or accumulation volume may not be enough to support the price rise and a price decline may be forthcoming.
The accumulation distribution indicator is a momentum indicator. It is used by traders to predict trend reversals by detecting tops and bottoms.
It does this by showing the link between the price of an asset and the number of buyers and sellers in that market. Traders determine if the market is bullish (accumulating) or bearish (distributing). They do so by identifying a divergence between the price and the indicator.
For instance, if an asset is in an overall downtrend but the price has recently increased, this can indicate that demand for the asset is beginning to rise – the sellers are losing power and the buyers are beginning to gain power. The ADL will begin to head in the opposite direction, away from the price, suggesting a reversal may happen.
What does the Accumulation/Distribution indicator tell traders?
ADL shows the balance between supply and demand
The accumulation/distribution line helps to show how supply and demand factors are affecting price. A/D indicator can move in the same direction as price changes or it may move in the opposite direction.
The multiplier in the calculation offers a gauge for how strong the buying or selling was during a specific period. It does this by determining if the price closed in the upper or lower portion of its range. This is then multiplied by the volume.
When a stock closes next to the high of the range with high volume, it creates a huge A/D jump. If the price ends close to the high of the range but volume is low, the A/D will not move up as much. If volume is high but the price ends more towards the middle of the range, the A/D line will also not move up as much.
The same concepts apply when the price ends in the lower portion of the price range of the period. Both volume and where the price ends within the period’s range determine how much the A/D line will decline by.
ADL helps traders assess price trends
The ADL is used to help assess price trends and potentially spot future reversals. If the price of a security is in a downtrend while the ADL is in an uptrend, the indicator shows there may be buying pressure and the price of the security may reverse to the upside.
On the other hand, if the price of a security is in an uptrend while the ADL is in a downtrend, the indicator indicates that there may be selling pressure, or higher distribution. This warns that the price may be heading for a decline.
In both situations, the steepness of the A/D line gives insight into the trend. A strongly rising A/D line confirms a strongly rising price. Also, if the price is falling and the A/D is also falling, then there is still plenty of distribution and prices will probably continue to decrease.
How to use the Accumulation/Distribution indicator?
The accumulation distribution line is a cumulative measure of the flow of volume or money of every time. A high positive multiplier used together with high volume indicates strong buying pressure that drives the indicator to a higher level. On the other hand, a low negative number joined with high volume reflects strong selling pressure that pushes the indicator lower.
Money flow volume piles up to make a line that either confirms or contradicts the underlying price trend. In this case, the indicator is used to either reinforce the underlying trend or lay doubts on its sustainability.
An uptrend in prices with a downtrend in the accumulation distribution line means an underlying selling pressure that could foreshadow a bearish reversal on the price chart. A downtrend in prices with an uptrend in the accumulation distribution line indicates underlying buying pressure that could foreshadow a bullish reversal in prices.
Biggest mistakes to avoid
One way of avoiding losses during a trending market is to trade using indicators agreeing with the trend. This means that if the market is moving up very strongly for a sustained time, you would only look for buying opportunities as the market pulls back down against the trend and retraces. On the other hand, if the market is trending very strongly down, then only look to trade bearish indicators as the price retraces back up against the trend. This strategy can protect traders from having heavy losses and strings of losing trades during very strong trends.
Pros & Cons
In some instances, using the A/D line can give traders clear benefits such as:
- Monitoring the overall money flow: The ADL indicator can be used as a gauge for the overall flow of cash. The move higher of an A/D indicator is an indication that buying pressure is beginning to prevail. On the other side, the downward move of an A/D indicator signals increased selling pressure is starting to gain strength.
- Confirmation: You can also make use of the A/D indicator to confirm the strength, and possibly the longevity, of a recent move.
There are also some drawbacks to keep in mind when analyzing a security using the A/D indicator, such as:
- Trading gaps: The A/D doesn’t take trading gaps into consideration. So when these gaps occur, they may not be factored into the A/D indicator at all. If the price of a stock has risen upward but ends around the middle, that gap will be ignored. It’s due to the fact that A/D line is formed using closing prices.
- Minor changes: At times, it can be hard to detect little changes in volume flows. The rate of change in a downtrend could be reducing, but this would be difficult (if not impossible) to detect until the ADL turned upward.
Conclusion
The ADL is an efficient tool for spotlighting buying and selling pressure on a security or stock. It is also a great way to confirm an existing trend. Using the A/D line alone is one way to analyze a security. It can also be used with either RSI or MFI to refine an analysis.
Both RSI and MFI function well with the ADL indicator. Using them combined can help provide a better sense of overbought or oversold conditions. In the end, the AD line is an effective tool in any trader’s arsenal.