
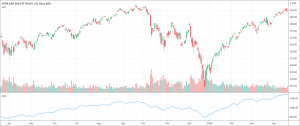
- The advance/decline (A/D) line is a breadth indicator that plots the difference between advancing stocks and declining stocks.
- A/D line should move in the same direction as major indexes to confirm the move.
- If it doesn’t, it’s a sign the rally or decline is nearing its end.
What is the A/D line ?
The advance/decline (A/D) line is a breadth indicator that plots the difference between advancing stocks and declining stocks. The difference indicates the participation of all the securities in the overall movement of a market’s index. The value is positive when the number of advancing stocks is greater than the declining stocks and vice versa. Once the A/D ratio confirms the movements in the same direction when compared with the index, it indicates either bullish or bearish momentum divergence. The failure of confirmation highlights the risk of a trend reversal. The advance/decline line indicator is especially more useful when trading the main indexes such as the S&P 500, DAX, Dow Jones Industrial Average, etc.
Basically, the advance/decline ratio gives an idea of what the market participants are doing when the market is slumping or rallying. A/D ratio actually indicates a key market sentiment that highlights whether more stocks are rising or declining at a particular point of the trading day. The purpose of the use of the A/D line is the confirmation of trends in the market indexes and to indicate the reversals when divergences occur. Moreover, it is also interesting to note that the advance/decline indicator is a cumulative one that works by adding positive numbers to the previous value and subtracting negative numbers from the previous value.
How to calculate the advance/decline ratio?
The advance/decline ratio or advance/decline line calculation is very simple. The A/D ratio has the following formula.
Advance/decline line = Net advances + Previous advances
* Net advances = Daily advancements – declining stocks
* Previous advances = Previous reading of the indicator
There are two simple steps to calculate the advance/decline ratio.
- Calculate the net advances by subtracting the stocks finishing lower on the day from stocks finishing higher.
- Calculate the net advances on the next day by adding positive value to the prior day’s total or subtracting negative value from the previous total.
What does the advance/decline line indicator tell traders?
The advance/decline line is very useful for traders to confirm trend strength. It has also the potential to indicate a possible reversal of the current trend in the market. A/D ratio also tells traders about the market stock’s participation in the direction of the market.
How to interpret the advance/decline line indicator?
It is a bearish divergence when the indexes move up but the A/D line slopes downwards. It is actually an indication that the market is losing its breadth and there is a strong chance of market reversal. The market is strong when the market is trending upwards and the A/D line also slopes up. It is a bullish divergence when the indexes continue to move downwards but the A/D line turned upwards. It is a signal that sellers are disappointed. Finally, there is a strong chance of a continuation of declining prices when the indexes and A/D both move downwards.
Conclusion
The advance/decline line indicator is a unique breadth indicator that helps traders to determine the total of stock participating in a stock market advances or decline. The A/D ratio is a simple calculation that gives the difference between advancing stocks and declining stocks. It helps to determine the strength of the trend and also alerts to a potential upcoming reversal. There are simple rules, discussed above, that help to interpret the advance/decline line indicator. However, traders need to be aware of the most important limitation of the A/D line indicator. Some indexes in the market are market-capitalization-weighted which means those stocks are more significant and greatly affect the index’s movement. They need to be assigned more weight but the A/D line equally weighs all the stocks in the market. Therefore, it is not useful for large or mega-cap stocks.