
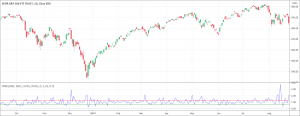
- Arms Index and TRIN indicators are two names for the same indicator.
- The Arms Index is an oscillator which measures market volatility.
- It helps to gauge the overall sentiment in the market.
The Arms Index is an oscillator and a leading indicator that helps to measure market volatility. It helps to gauge the overall sentiment in the market. The Arms Index also helps to predict the upcoming price movements in the future. It is also known as the Short Term Trading Index or as the TRIN. The TRIN words are derived from Trading and Index. The TRIN is one of the best technical analysis tools for intraday trading and that is why it is known as the Short Term Trading Index.
Richard W. Arms developed the TRIN indicator in 1967. He worked to develop a study that could help in trading through measuring the impact of both, the rising and the declining stocks. Arms also wanted his study to take volume, another important measure, into consideration. The Arms Index was the solution. Thus the TRIN works on the basis of a comparison of advancing and declining stocks to advancing and declining volume.
How to calculate the Arms Index or TRIN?
The calculation of the Arms Index involves three steps.
- First, calculate the ratio of advance/decline.
- Secondly, calculate the ratio of advance/decline volume.
- The calculation of the index is the last step.
The formula for the TRIN calculation is:
TRIN = Advancing Stocks / Declining Stocks ÷ Advancing Volume / Declining Volume
How to interpret the Arms Index?
The interpretation of the TRIN is not a complicated one. TRIN will be below one when the advance/decline volume gives a higher ratio than the advance/decline and vice versa. The TRIN value below one suggests a strong advancement in the price because of the strong volume of the rising stocks helps to rally prices. Conversely, The TRIN value above one suggests a strong decline in the price because of the strong volume of the declining stocks helps to fall prices and encourage sell-off. It is important to note the Arms Index moves in the opposite direction of the index’s price trajectory. The TRIN will move to lower levels whenever there is a strong price rally. The TRIN will move to higher levels whenever there is a strong price decline.
What does the Arms Index tell traders?
The TRIN tells traders about the market’s volatility and it issues signals in three possible ways.
- The TRIN value of one indicates that the advance/decline ratio and advance/decline volume ratio are equal. It suggests a neutral market condition. In simple words, it shows that the advancing volume’s distribution is even over the advancing issues and the declining volume’s distribution is even over the declining issues.
- The TRIN value less than one suggests a strong bull market because the advance/decline volume gives a higher ratio than the advance/decline. The Arms Index usually gives TRIN value less than one when there is a strong price advance because of strong volume in rising stocks.
- The TRIN value above one indicates a strong bear market because advance/decline volume gives a lower ratio than the advance/decline. The Arms Index usually gives TRIN value above than one when there is a strong price decline because of strong volume in falling stocks.
How to use the TRIN indicator with your trading?
Traders often use the Arms Index in trading. The TRIN values are important for its best use in trading. Traders generally consider the TRIN values below one as a buy signal because of a bullish market. Conversely, they consider the TRIN values above one as a sell signal because of the bearish market. The market is stronger, either bullish or bearish when the TRIN values move away from neutrality. However, it is important to note that the market may soon reverse when the TRIN values move too far away from 1. The TRIN values above 3 or below 0.5 can prove a signal of an imminent reversal.
Moreover, the Arms Index has also certain limitations and traders should be aware of them. For example, issues with the TRIN calculations may arise because it puts too much emphasis on volume, and inaccuracies in calculations may occur when there isn’t enough advancing volume in advancing issues as per expectations. Although it is not a situation that occurs too often, it is a situation and may affect trading. Therefore, it is always a prudent strategy to use the Arms Index in conjunction with other technical analysis tools to avoid losses in financial trading.