
Introduction
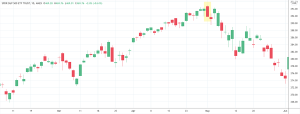
Candlestick charts are technical tool that put together data for numerous time periods into single price bars. This enables them to become more important than traditional open-high, low-close bars or simple lines that links the dots of closing prices. Candlesticks forms patterns that forecasts price movement once completed. Standard color coding gives more value to this colorful technical tool, which has been in existence since 18th century. It was first implemented by the Japanese rice traders.
Candlestick charts are implemented by traders to predict possible price direction, based on previous patterns.
Candlesticks are important when trading as they indicate the four price points (open, close, high, and low) throughout the period/time the trader specifies.
A lot algorithms are based on similar price information shown in candlestick charts.
Trading is usually determined by emotion, which can be read in candlestick charts.
How to identify Black Candles and how does it compare?
Coloring candlesticks is actually much difficult than it does appear to be. Something that do cause confusing with people is them thinking that there is such thing a thing as “white candlestick”. In actual sense, there isn’t. What appears to be a White candlestick is simply a candlestick that has hollow and a black candle stick is one that is filled.
The black candle usually appears on the candlestick charts. In a downtrend, it should be read mostly as a signal’s strength of a trend which we can expect to continue. A candle of this type can also be a part of a bullish reversal pattern (e.g. Last Engulfing Bottom, Piercing, and Bullish Harami). The black candle may also be present during an uptrend. Then it is crucial to break down the broader market context. First, in the case of white candles, one should be very careful with the liquidity of the market.
At low liquidity, the set of black candles in an uptrend may show that market traders use the final phase of the trading session to sell assets consistently, which as a result may cause a major breakdown. This, however, is an extreme situation in markets with low liquidity. More often, the black candle in an uptrend may be the part of a bearish reversal pattern (e.g. Dark Cloud Cover).
What does a Black Candlestick mean on a chart?
A black candlestick develops on a chart set for hollow candles where all candlesticks will be set for filled or hollow and will appear as white, red, or black. The black candle develops when price closes beneath its opening but the closing price is still higher than the previous close.
The black candle can be a reversal or continuation signal depending on where it comes up on a chart pattern.
In an uptrend a black candle developing can indicate the close of the trend and that the tendencies have shifted to a downswing in price or at least that the chart will start to go sideways, this can be a reversal signal. In a downtrend in price, the black candle indicates a failure of price to hold higher marks as it closes off the highs of the period which can indicate a continuation pattern.
A black candle is a bearish candle where ever it appears on a chart and indicates that the attempt of the buyer to keep prices higher failed on that attempt, even though it closed above the previous candle’s highs.
A trader doesn’t want to see a black candle develop while they are long on a chart. This indicates a failure of momentum to move higher.