
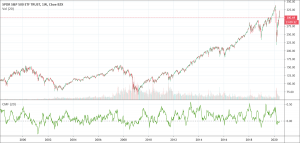
Created by Marc Chaikin, this Chaikin Money Flow indicator measures the amount of money flow volume over a particular time. Money flow volume is the basis for the accumulation/distribution Line. Rather than having a cumulative total, Chaikin money flow combines money flow volume for a particular look-back period, usually 20 or 21 days.
- The Chaikin Money Flow oscillator is a momentum indicator.
- It fluctuates between -1 and 1.
- It measures how money flow in and out of a given security.
What is the Chaikin Money Flow indicator?
Chaikin money flow (CMF) is a technical analysis tool which helps to measure money flow volume (MFV) over a particular time. MFV is a metric which measures the buying and selling pressure of a security for single time. The CMF then combine money flow volume over a user defined look-back time.
The value of CMF fluctuates between 1 and -1. CMF quantifies changes in buying and selling pressure. It can help to anticipate future changes and therefore trading chances.
The resulting indicator fluctuates above and below the zero line just like an oscillator. Traders weigh the balance of buying or selling pressure with the absolute level of this indicator. Also, chartists can observe to see crosses above/below the zero line to identify changes on money flow.
The standard CMF period is three weeks. The principle behind the CMF is that, the nearer the closing price is to the high, the more accumulation has occurred. On the other hand, the closer the end price is to the low, the more distribution has occurred.
If the price action always closes above the midpoint of the bar on increasing volume, then the Chaikin money flow will be positive. On the other hand, if the price action always ends lower than the midpoint of the bar on increasing volume, the Chaikin money flow will be negative.
The indicator is a measure of momentum under the idea most market technicians hold, that price follows volume. Fundamentally, it is a money flow oscillator that operates like the MACD indicator.
What does the Chaikin Money Flow indicator tell traders?
Some traders use the Chaikin Money Flow indicator to define a general buying or selling rule simply with negative or positive values. The indicator moves above/below the zero line. In most instances, buying pressure is stronger when the indicator is positive. Selling pressure is stronger when the indicator is negative.
Even though this zero line cross appears simple enough, the reality is much choppier. Sometimes, Chaikin Money Flow indicator only briefly crosses the zero line with a move that turns the indicator barely negative or positive. There is no follow through and this zero line cross ends up becoming a bad signal. It is the role of chartists to use buffers and filter these signals by setting the bullish threshold a little above zero and the bearish threshold a little below zero. These thresholds will not totally get rid of the bad signals, but can help lower whipsaws and filter out weaker signals.
Chaikin Money Flow is not ideal for all securities. It is necessary to analyze the basic price trend and the characteristics of an indicator with a particular security.
How to use the Chaikin Money Flow indicator?
This indicator works on these principles:
- A CMF value more than the zero line is an indication of market strength. A value less than the zero line is a sign of market weakness
- Wait for the CMF to confirm the breakout direction of price action through trend lines or support and resistance lines. For instance, if a price breaks upward through resistance, wait for the CMF to have a positive reading to confirm the direction of the breakout
- A CMF sell signal happens when price action makes a higher high into overbought zones, with the CMF diverging with a lower high and starting to fall
- A CMF buy signal can be seen when price action makes a lower low into oversold zones, with the CMF diverging with a higher low and starting to increase
Biggest mistakes to avoid with the CMF
Ideally, the Chaikin Money Flow indicator should be used together with a price chart and other indicators. It is mostly used to determine trending or breakout price behavior rather than produce trade signals on its own.
The time of the CMF should be customized to the preference of each trader. The 21-period default is more oriented for shorter-term traders. This setting is most necessary for those looking to capture shorter-term trends relative to the charting timeframe.
A different day period would be more applicable for traders looking at intermediate and longer trends. But the longer the period, the longer it will take for new price trends to come up because a lot of previous data is taken into account. For short-term traders, using a 24-period CMF on a 5-minute chart would offer two hours of trend/momentum data.
Pros & Cons
Pros
- Useful indicator during trending markets
- Useful for confirming trend direction
- Can provide potential exit signals when there is potential for a trend reversal
Cons
- Trader should not use it alone
- Traders cannot know potential stop-loss and take-profit positions
- Can give false signals during range-bound market conditions, because the values can fluctuate around the zero-line
- It would be best if not used on smaller time frames
The Chaikin Money Flow indicator is a tool to help weigh the strength of a trend. It is not a trading system created to offer stop-loss points or pinpoint entry and exit locations. Therefore, traders typically use it in combination with other technical indicators that can provide further information. It can however, be taken as a signal to exit out of trades if the trend turns or breaks a particular level of interest to the trader.
Conclusion
The CMF is a trend strength indicator that depends on price and volume data. A positive value denotes an uptrend over that period, while a negative value denotes a downtrend.
If the CMF itself is seen in an uptrend, the asset is considered accumulated or bought. On the other hand, if the CMF is in a downtrend, this may be seen as the asset being sold or distributed.
Ideally, the indicator should be used to cover a period that is important to your trading timeframe. While the CMF has previously been used in a 21-period setting on a daily chart, this will not be best for day-traders who mainly trade from the 5-minute to hourly chart.
For people that are trading from the 5-minute chart, a 36-period CMF would interpret the trend from the past three hours of price data, and a 96-period CMF would capture the trend of the past eight hours.
Traders who use the hourly/60-minute chart hold positions over the course of several days, rather than only intra-day. In this instance, a 24-period CMF would give the trend over the past day, with a 120-period CMF giving the trend over the past week.
Stop-loss and take-profit levels are not something the CMF offers. These have to be determined through alternative indicators or in accordance with the limitations of the trader’s risk. Exit points may nonetheless be determined through a specific shift in the CMF, like a change in its value from negative to positive or vice versa.