
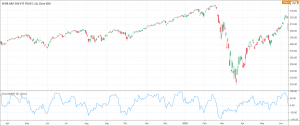
- The Chande Momentum Oscillator (CMO) is a momentum indicator.
- It is calculated as the difference between the sum of all recent ups and the sum of all recent downs and then divided by the sum of all price movements during a predefined period.
The Chande Momentum Oscillator (CMO) is a technical analysis tool to measure the momentum of a security. Tushar Chande developed the CMO indicator and introduced it in his new book The New Technical Trader published in 1994. The CMO values are actually the difference between the sum of all recent ups and the sum of all recent downs and then divided by the sum of all price movements during a predefined period.
The Chande Momentum Oscillator’s calculations are just the total net change over a period divided by the absolute value of the individual net changes over that period. The values of the CMO range between – 100 and + 100. The CMO values above 50 are interpreted as overbought market conditions while the CMO values below – 50 as oversold market conditions. The time period is normally set to 20.
How to calculate the Chande Momentum Oscillator?
The calculations of the Chande Momentum Oscillator rely on a few simple steps.
- Calculations of the sum of higher closes over a predefined period.
- Calculations of the sum of lower closes over a predefined period.
- Calculate the difference between the values of step 1 and step 2.
- Add the values of the sum of higher closes and the sum of lower closes.
- Divide the result of step 3 by step 4 and multiply by 100.
The formula of the Chande Momentum Oscillator is the following.
Chande Momentum Oscillator = {(sum HC – sum LC) / (sum HC + sum of HC)} × 100
How to interpret the Chande Momentum Oscillator?
The CMO indicator’s values oscillate between – 100 and + 100. The overbought zone lies above 50 while the oversold zone lies below – 50. It also helps to measure the strength of the current trend in the market. The higher CMO values suggest a strong trend and vice versa.
Moreover, a moving average can also help to smooth the indicator. It is possible to calculate two moving averages to determine bullish or bearish sentiment in the market when they cross. Traders and technical analysts can also draw support and resistance lines on the CMO indicator and they can also study divergence. When the prices make new lows but the CMO fails to make new lows, it is an indication of a bullish divergence. Conversely, prices making new highs but the CMO fails to make new highs is a signal of bearish divergence.
How to trade with the CMO?
The Chande Momentum Oscillator is very easy to handle for trading. Traders can go short when the CMO is above the overbought level at 50. On the other hand, traders can go long when the CMO indicator is below oversold level at – 50. Many traders also use the CMO indicator for entry signals. Traders use shorter time frames for this. They use crossovers of a signal line from a moving average of 9-periods for this purpose. The Chande Momentum Oscillator also warns of reversal through divergences between the price and the CMO. Traders can use this fruitful information for trading as well.