
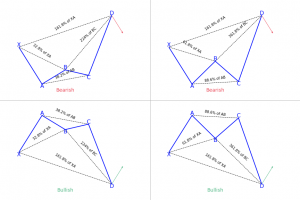
Harmonic trading is a kind of technical analysis generally used across futures, stocks and forex. Harmonic trading makes use of particular price patterns which are subject to alignment of specific Fibonacci extension and retracement levels.
As a result of the combination of the structure of the pattern and the Fibonacci ratios, harmonic trading detects potential reversal zones in the security being analyzed.
These patterns are contrarian reversal and can indicate a change in the price direction. This may be a temporary correction or even a trend change. No technical indicators are used in harmonic pattern trading, except for the retracement tool and Fibonacci extension.
- The Crab & Deep Crab harmonic patterns are reversal patterns
- There are 4 legged patterns
- The crab pattern follows strict fibonacci ratios
- The deep crab pattern also follows fib ratios (but with a slight variation)
Interested in learning more about harmonics pattern in general?
You’ll love this two courses I shortlisted for you on Udemy:
- Forex Harmonic Pattern Trading – With Multiple Chart Examples: it’ll teach you step-by-step how to identify most harmonic pattern applied to forex markets.
- Harmonic Trading: The Art Of Trading With Low Risk: it’ll guide you to your first harmonic trades, what are potential reversal zones and it’ll give you practical applications so you can truly understand how to use it.
If you prefer to skip the learning part and are just looking for a harmonic patterns scanner, you might want to check this harmonic patterns screener here. You’ll get a 7-days free trial (+ 50% off your 1st month subscription if you decide to continue).
Or you can just continue reading and learn more with our article below about crab patterns.
What is are the Crab & Deep Crab patterns?
The deep crab is another form of the crab pattern. It is formed by combining a bat pattern and crab pattern.
The Crab harmonic pattern
The pattern follows some specific features
The pattern was discovered in 2001. Just as it is with other harmonic patterns, this pattern is a reversal pattern. Therefore, we have the bearish crab pattern that indicates a bearish reversal in price and a bullish crab pattern that indicates a bullish reversal in price. Just as it is with other patterns, there’s a naming convention for every leg in the formation.
Beginning with the swing low or high, every leg is marked by a letter. There are five swing points named as X, A, B, C and D. In some patterns, you will only find four (X, A, B and C).
The crab pattern is different because of its sharp movement in the CD leg. This is usually a 1.618 percent Fibonacci retracement of the XA leg, the previous part of the crab pattern.
Some rules that have to be followed to confirm a crab pattern, such as:
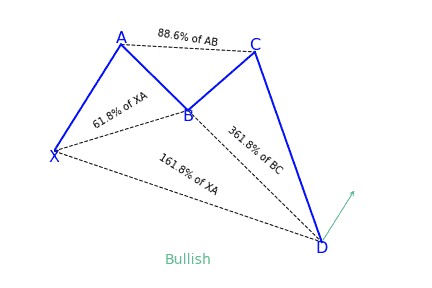
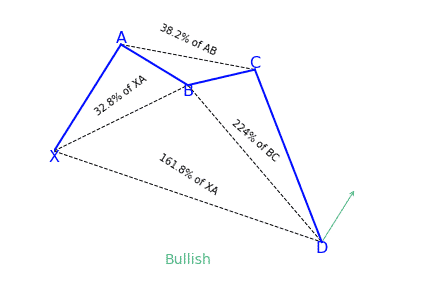
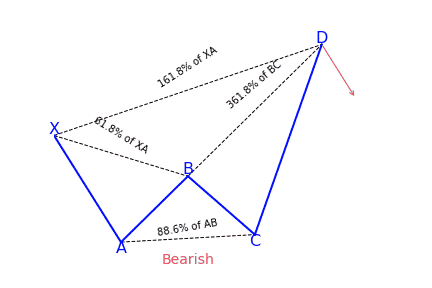
- Following the XA leg in price, the point B is a retracement of between 38.2 to 61.8 percent. This retracement should ideally be lower than 61.8 percent
- The AB leg, is a counter trend move to the initial leg
- After point B, the next leg, BC, can run up to 38.2 to 88.6 percent Fibonacci ratios of the AB leg (C should never go beyond point A)
- Following the BC leg, price reverses once again, with the CD leg being the longest and reversing between 161.8 percent of the XA leg and an extreme 224.0 to 361.8 percent extension of the BC leg
Then you should wait for confirmation
After the crab pattern confirms these factors, a position can be taken after the CD leg is made. Even though you will not notice the CD leg is always reversing close to 161.8 percent, if price action starts to stall and such a reversal begins to happen, it can be a high probability trade setup.
It is always better to wait until point D is made and then take an appropriate short or long position. Stop-losses are placed at the low or the high of D, and targets are typically points A or B in the pattern.
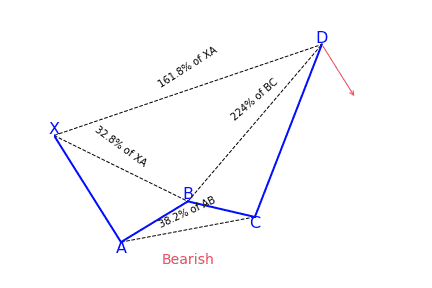
The Deep Crab harmonic pattern
The deep crab is a variation of the normal crab pattern. It is still a 5-point extension, and it still has the endpoint, D, at the 161.8 percent extension of XA, but the little difference is in the AB=CD importance.
The most distinguishing component of this pattern is the importance of the particular 88.6 percent retracement point of B. Together with the crab pattern; the deep crab pattern presents an especially extended and long move towards D.
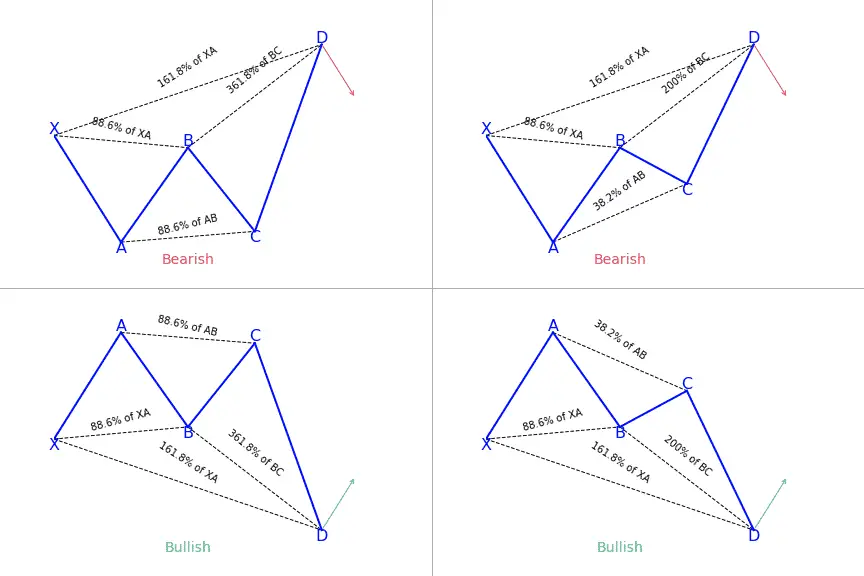
Major differences between the Crab and Deep Crab patterns
- Projection of the BC leg is not as extreme as the crab
- B has to be at least an 88.6 percent retracement. Common to move more than 88.6 percent retracement level not above/below X
- AB=CD pattern variations are more vital in the deep crab pattern
- The BC leg is a minimum of 224 percent but can extend to 361.8 percent
How to identify the Crab & Deep Crab patterns?
It can be hard to be familiar with the Fibonacci retracement and extension values in a crab pattern. Also, it can become tiring when using the Fibonacci tool to measure each leg while drawing the crab pattern.
Aside from the main rules of the crab pattern, traders can look for the following signs in the market, by analyzing the lows and highs and simply observing the price movement.
- BC leg mostly exists within the XA leg
- C is a higher low as opposed to A in a bearish crab pattern or C is the lower high as opposed to A in a bullish crab pattern
- B makes a lower high when compared to X in a bearish crab pattern, or B makes a higher low when compared to X in a bullish crab pattern
- D is the extreme, indicating a lower low or a higher high, going beyond X
What does the Crab (and Deep Crab) harmonic pattern tell traders?
Just like the butterfly, it can help traders identify when a current price move is likely getting to its end. This means traders can enter the market just as the price changes direction in the opposite way.
The crab and deep crab represent important overbought and oversold conditions, and reaction after completion is mostly sharp and fast. It is the opinion of many analysts and traders that the crab pattern and deep crab represent some of the quickest and most profitable patterns out of all harmonic patterns.
How to trade when you see the pattern?
Trading a bearish Crab pattern
To trade a bearish crab pattern, put a short (sell) order at point D (the 161.8 percent Fibonacci extension of the XA leg).
- Entry: Identify where the pattern will end at point D, and place your order
- Stop-Loss: Put your stop-loss just below point D
- Take Profit: The location of your profit target is highly subjective and depends on your objectives and market conditions. If you desire aggressive profit, place it at point A of the pattern. For a more conservative profit, place it at point B.
Trading a bullish Crab pattern
First of all, choose the crab pattern charting tool and follow all the above rules to identify the pattern. Remember that the Fibonacci ratios are very important to trade the crab pattern. If you notice the pattern on a price chart and if you find the ratios not matching with the pattern rules, it means that the pattern is not valid. So do not trade that pattern.
When the price action confirms the pattern, immediately enter for a buy. If you are a conservative trader, ensure you wait for a couple of bullish confirmation candles before entering the trade.
There are four targets (X, B, C, A) to place the take-profit order in the crab pattern. At the start, traders try to book full profit at point A, but when the price crosses point B, the market turns sideways. So book half of your profit at point B and then close your full positions at point A.
Most of the traders placing their stop-loss way below point D; however, that’s a wrong way to do it because they are risking more due to this simple logic. If the price action breaks point D, it automatically invalidates the pattern.
Crab pattern vs. Butterfly pattern
The two main things that differentiate the crab pattern from the butterfly pattern is that a butterfly pattern has a swing point D that ends at the 127.2 percent Fibonacci extension of the XA leg. Also, the butterfly pattern retraces to 78.6 percent of the previous XA leg.
But when you consider the crab pattern, the swing point D ends at the 161.8 percent extension of the XA leg and terminates the AB leg between 38.2 percent and 61.8 percent. These two major differences in the Fibonacci ratios between the crab pattern and the butterfly pattern make them unique from each other.

Looking for a way to automatically find harmonic patterns in your favorite markets?
You definitely need a screener for that! Check out this harmonic patterns scanner here!
If you come from us (simply click the link below), you’ll get a 7-days free trial and 50% off your first month’s subscription fee. Don’t think more, go test it out for free now!
Click here to signup and claim your 7-days free trial to the best harmonic pattern scanner.