
- Divergences occur in the market when price doesn’t move in the same way as an indicator.
- If price makes a new high/low but the indicator does not, it creates a divergence.
- It helps traders spot moments where price move is not a strong/weak as it looks to be.
- It is a great signal to hunt for reversal or close current positions.
Divergence is the key factor to become decisive and proficient about the execution of a trade. The practicality of the role of divergences is quite significant and profitable. Divergences between the indicators and the prices are also a very interesting concept that is widely used in technical analysis. Therefore, it is necessary for a technical analyst or a trader to take a closer eye on this concept.
The word “divergence” means to move or draw apart. Similarly, in technical analysis terms, divergences mean when there is a conflict between the price movement and the technical indicators that you use for technical analysis. For example, when the prices make a higher high but the technical indicator is showing a lower low, it is a divergence. The divergences occur when the movement of the actual price of a stock does not synchronize with the indicator.
Divergence can be positive or negative. The positive ones occurs when an indicator is indicating a new high while the prices make a new low. Conversely, when the indicator indicates a new low while the prices make a new high, it is a negative divergence.
What does the divergence signify?
The divergence is a very important concept in technical analysis. It indicates a positive or negative movement in the stock prices. Divergences also help to analyze the underlying momentum in the prices and to predict an upcoming potential change in trend.
The divergence tool is not lagging and always strictly follows the price action. Its analysis provides great support to predict the behavior of future prices. Furthermore, as we know that market volatility causes divergences and we also know that increasing market volatility means increased trading opportunities over a course of a given time period. As it follows the price action and price action always gives precise and up-to-date information. Therefore, paying great attention to strong divergences can give many trading opportunities to the traders.
Types of divergences
The divergences can be categorized into two main categories.
- Regular divergences
- Hidden divergences
Regular divergences
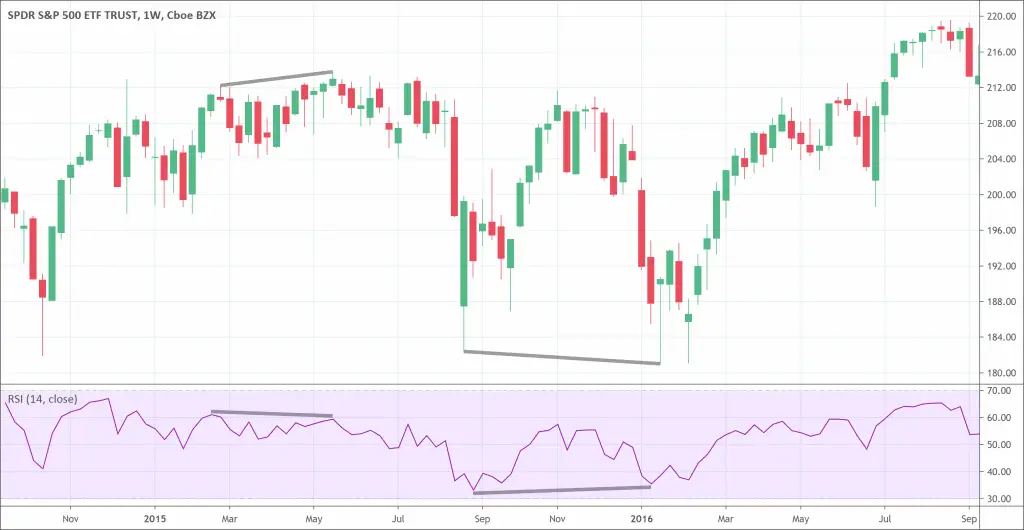
Regular divergences are further divided into subcategories regular bullish divergence and regular bearish divergence. They are helpful at indicating a price reversal.
- A regular bullish divergence occurs when the actual prices of the stocks show lower lows as compared to higher lows indicated by the indicator.
- A regular bearish divergence occurs when the actual prices show higher highs as compared to lower highs indicated by the indicator.
Hidden divergences
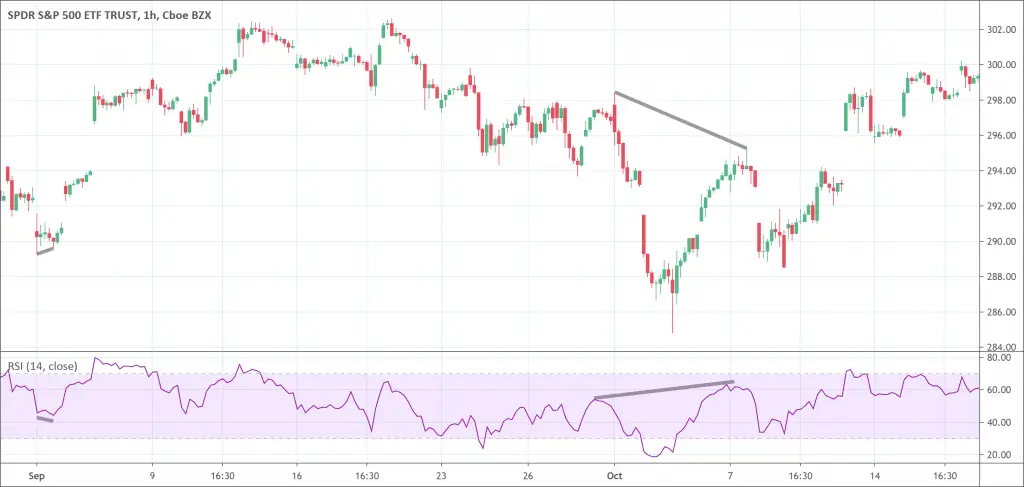
As for regular ones, hidden divergences are also of two types. Hidden bullish divergence and hidden bearish divergence. Hidden divergences are opposite to regular divergences and indicate that down retracement is over and the trend will likely continue.
- A hidden bullish divergence occurs when the actual stock prices show higher low as compared to the indicator’s lower lows. Bullish divergences indicate an upcoming reversal in the trend or at least a retrace of the downtrend.
- A hidden bearish divergence occurs when the actual prices of the stock indicate lower highs as compared to the higher highs indicated by the indicator. Bearish divergences indicate a potential fall in the price.
How to spot divergence in trading?
There are some key factors that traders need to understand before entering a trade.
- A chart working on at least two variables is a necessity to spot divergence. There are many tools that can be used for this purpose such as the Relative Strength Index (RSI) indicator.
- Look for a situation where the RSI indicated a trend reversal such as from downtrend to an uptrend.
- Now, find and analyze the corresponding area on the chart and spot divergence such as market high followed by a slightly higher high.
- Traders must know about the different price actions that can cause divergences.
With the passage of time and practice, you will be more proficient to spot divergences in real-time and to capitalize on them.
How to trade with divergence?
In order to make better trading decisions, it is crucial to understand how to spot the divergence. Having that understood, you can move on to learn about the divergence trading strategies.
- Entering the trade at the right time is the key to success. Haste as well as delay can cause problems for you. Patience is necessary to look for confirmation from the price action. The price confirmation occurs when the price goes beyond the trendline. Another key entry point is when the price breaks support and resistance levels. Whenever you spot any of those confirmations, it is always the right time to enter the trade.
- You can place stop-loss is above the top and below the reversal’s bottom. Placing a stop-loss allows you to be on the safe side to stay away from getting shocked by the unpleasant surprise.
Setting right and prudent profit targets is another div strategy that can help to get better returns on divergence trading. One common method to set profits is to create a trend line. You can remain in the trade unless and until the price doesn’t go beyond the trend line.
Conclusion
Divergences are one of the most important and commonly used concepts in technical analysis. It simply mean the non-synchronization between the indicator and the price action. Divergences indicate many things such as it indicates positive or negative movements in the stock prices. Regular divergences and hidden divergences are the two categories of divergence. Regular divergence further divides into regular bullish divergence and regular bearish divergence. Similarly, hidden divergences include hidden bullish divergences and hidden bearish divergences. A chart working on two variables at least is the requirement to spot divergences. There are several indicators like relative strength index (RSI) that also help to identify divergence. However, it is absolutely imperative to be patient and only enter the trade upon confirmation. Experience in divergence trading, however, can give you good profits with the proper application at the very right place.