
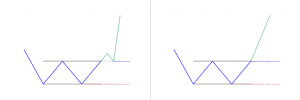
- The double bottom looks like the letter “W”
- Price touches twice a support level
- The double bottom pattern follows a downtrend
- It signals the reversal and the beginning of a potential uptrend
What is a Double Bottom classical pattern?
A double bottom pattern is a classic technical analysis chart pattern that shows a trend change and a momentum reversal from prior leading price action. It shows a price drop, a rebound, another drop to the same or similar level as the original drop, and finally another rebound.
The Double Bottom Reversal is a bullish reversal pattern that is typically found on line charts, bar charts, and candlestick charts. Just as its name, the pattern is made up of two consecutive troughs that are roughly equal, with a moderate peak in-between. This price action pattern is unique because it signals a level in the market where demand outweighs supply not once, but twice within a fairly short period of time.
How to identify the Double Bottom charting pattern?
The reversal is made up of two consecutive bottoms with approximately similar equal lows. This differs from the double top breakout because the setups are long trades, instead of short trades.
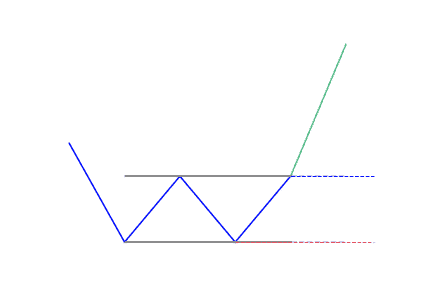
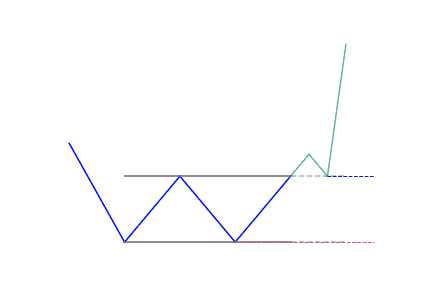
The first low is formed when the bearish trend finds support. Then the price retraces until it finds a resistance level that we call the neckline. In the second phase, the price goes downwards towards the support created early by the first peak. But it fails to break it, and rather rallies to the neckline again.
It has three parts to it:
- First low (first price rejection): The market bounces higher and forms a swing low. Here, it’s likely a retracement in a downtrend.
- Second low (second price rejection): The market rejects the previous swing low. Now, there’s buying pressure, but it’s too early to tell if the market could continue higher.
- Break of neckline (an area of resistance): The price broke above the resistance and it signals that buyers are in control. The market is likely to move higher.
What does the Double Bottom pattern tell traders?
The importance of the pattern depends on the timeframe
Most professionals that do technical analysis believe that the advance of the first bottom should be a drop of 10 to 20 percent. The second bottom should form within 3 to 4 percent points of the previous low. Also volume on the ensuing advance should rise.
Just as it is with other patterns, a double bottom is used best for analyzing the intermediate to longer-term view of a market. Generally, the longer the time between the two lows in the pattern, the greater the probability that the chart pattern will succeed.
There should be a consideration of at least three months for the lows of the double bottom pattern, in order for the pattern to produce a higher probability of success. It is therefore, advisable to use daily or weekly data price charts when analyzing markets for this pattern. The higher the timeframe, the better. Though the pattern may appear on intraday price charts, it is very difficult to determine the validity of the double bottom pattern when intraday data price charts are used.
The importance of the pattern depends on the context
The double bottom pattern always follows a minor or major downtrend in a particular security, and signals the reversal and the start of a potential uptrend. Also, the pattern has to be validated by market fundamentals for the security itself, as well as the sector that the security belongs to, and the market in general.
The fundamentals should reflect the qualities of an upcoming reversal in market conditions. Also, you should closely monitor volume during the formation of the pattern. A rise in volume typically occurs during the two upward price movements in the pattern. This increase in volume are a strong indication of upward price pressure. It serves as further confirmation of a successful double bottom pattern.
When the closing price is in the second rebound and is getting to the high of the first rebound of the pattern, and an expansion in volume is presently coupled with fundamentals that show market conditions that are conducive to a reversal, traders can consider to take a long position.
How to trade when you see the Double Bottom pattern?
The double bottom pattern is a good representation of seller exhaustion. When the sellers are tired, that’s the time when a trend reversal usually occurs. The strategy also gives a simple way to know your profit objectives.
Trading with these techniques is very different than trading tops and bottoms, because you have to be patient and wait for the trade setup to develop. There are basically three things traders need to trade the double bottom breakout, they are:
- A bearish trend
- Two equal bottoms located at the support
- Neckline breakout
Step 1: Identify the market phase
You need to do this because the double bottom reversal needs a downtrend. Just because you can spot the reversal that does not imply you have to jump in immediately. Have it in mind that you need the right context and everything needs to line up for a trade-able setup. So, the first step is to identify the phase or market condition. At any given time the market can be trading either up, or down, or it can go sideways.
Step 2: Find the historical precedent or chart pattern
You don’t want to make a trading decision without price confirmation, and in your case, use the reversal pattern. For you to effectively trade the pattern, you have to see two rounded bottoms. In technical analysis, a rounded bottom is just a price formation that comes after a downtrend; prices go downwards and then quickly rally, thereby creating a rounded bottom.
Step 3: Allow only a small variation between both bottoms
Don’t go after perfection. While trading, you will need to eliminate your idealistic mindset since the pattern will not appear perfect at all times. Therefore, you need to be flexible. This is why you should allow a small variation between the two bottoms.
Step 4: Purchase when it closes above the neckline
After identifying that the market phase and the characteristics of a good reversal, you should wait for confirmation that momentum is shifting. That indicator is a breakout candle.
Step 5: Place a stop-loss
Place it slightly below the support created by the double bottom reversal. You can easily identify risks by using the double bottom pattern. It gives you the change to trade with a close stop-loss, which is nice for keeping the losses at a minimum.