
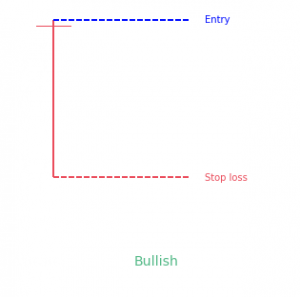
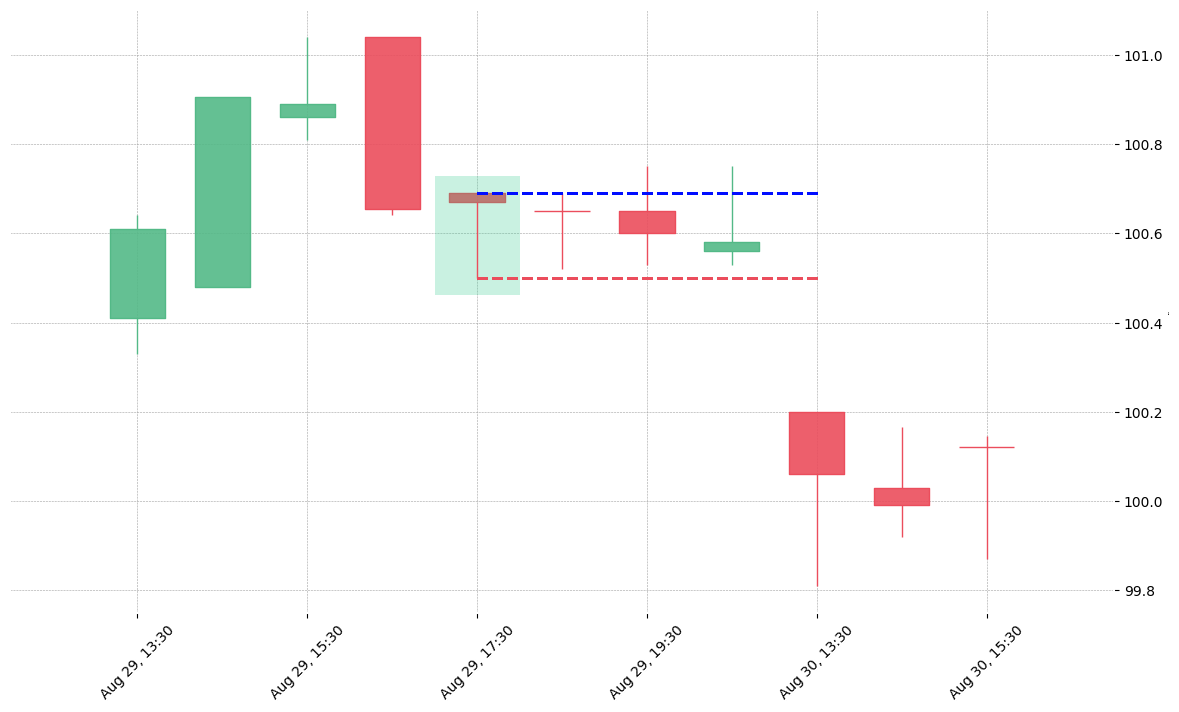
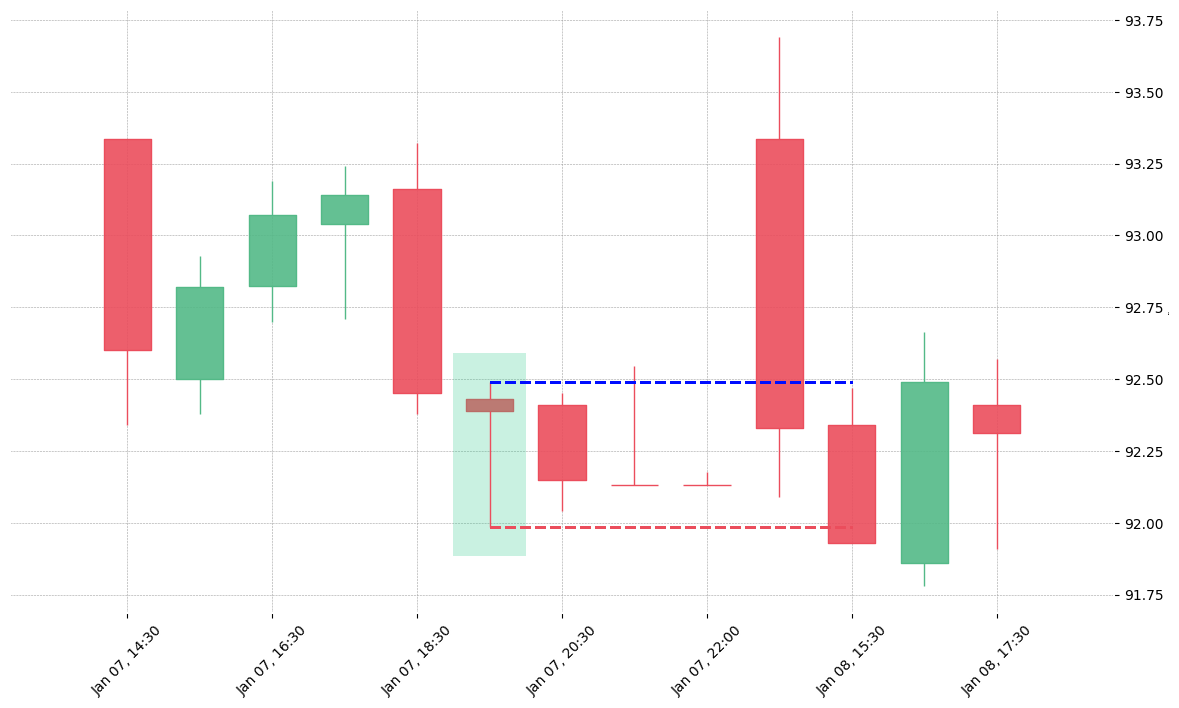
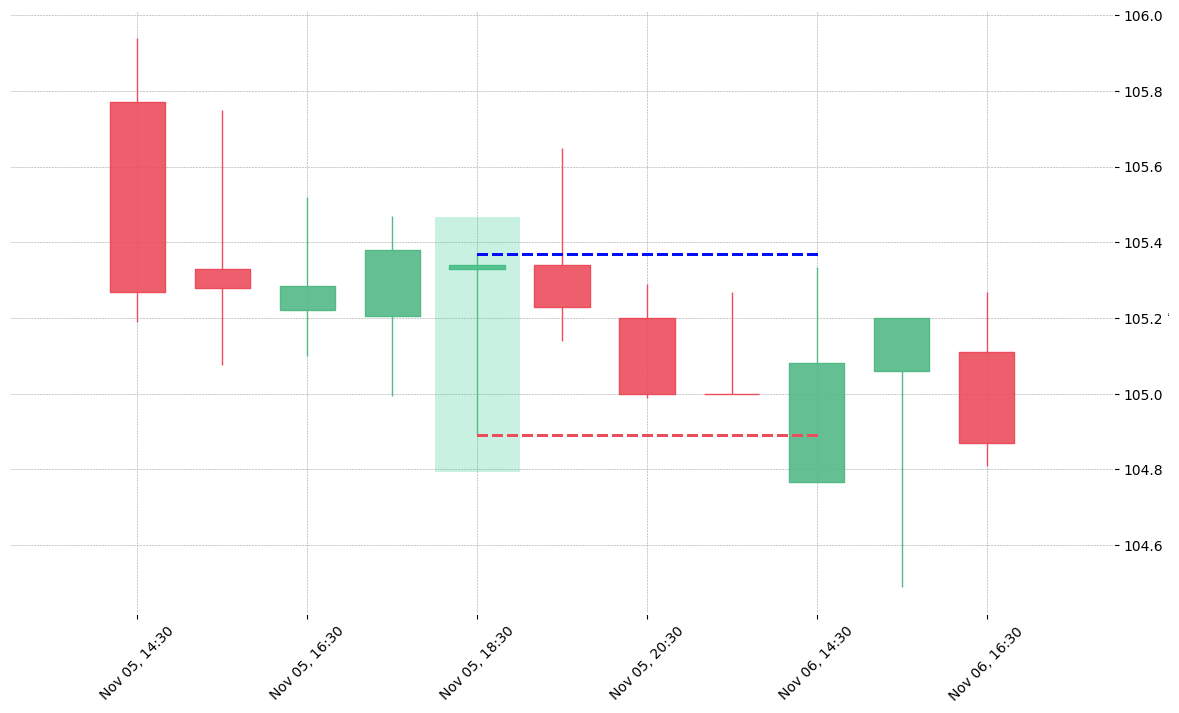
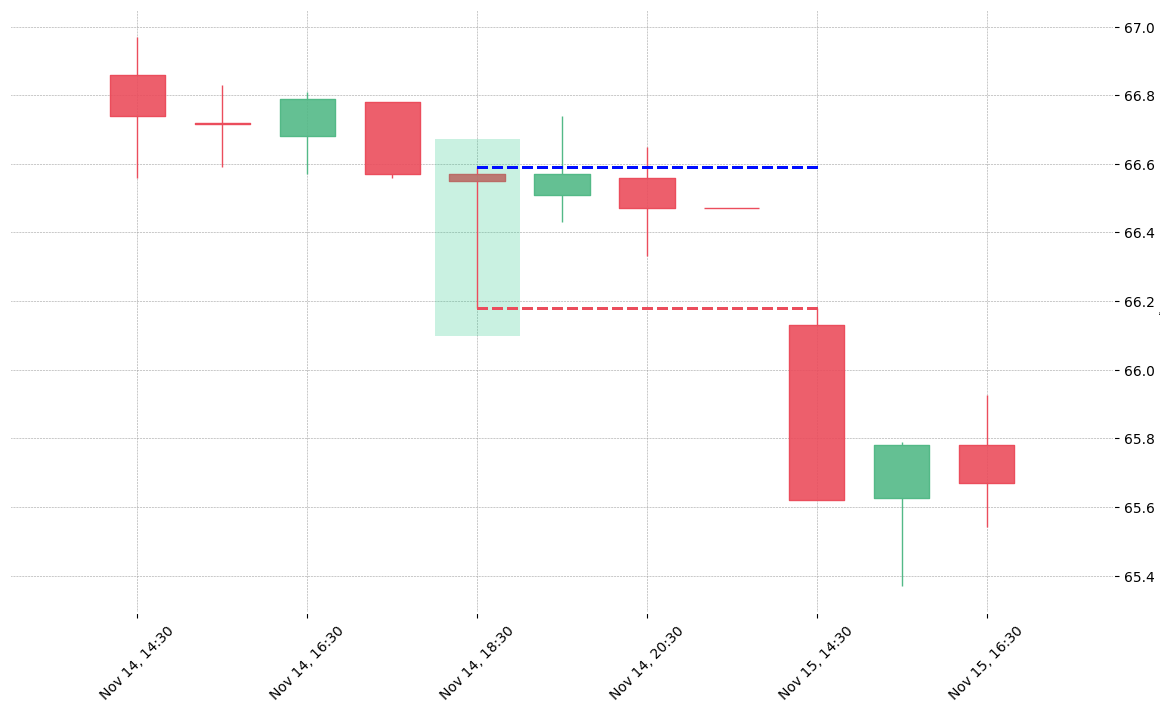
- The dragonfly doji candlestick pattern is a 1-candle bullish pattern.
- It looks like the letter “T”.
- It prints when the candle as a long bottom shadow but (almost) no upper shadow and open and close are almost the same.
Statistics to prove if the Dragonfly Doji pattern really works
Are the odds of the Dragonfly Doji pattern in your favor?
How does the Dragonfly Doji behave with a 2:1 target R/R ratio?
From our research the Dragonfly Doji pattern confirms 77.8% of the time on average overall all the 4120 markets we analysed. Historically, this patterns confirmed within 1.2 candles or got invalidated within 3.3 candles. If confirmed, it reached the 2:1 R/R target 35.1% of the time and it retested it's entry price level 95.6% of the time.
Not accounting for fees, it has an expected outcome of 0.054 $/$.
It means for every $100 you risk on a trade with the Dragonfly Doji pattern you make $5.4 on average.
Want to account for your trading fees? Have the detailled stats for your favorite markets / timeframes? Or get the stats for another R/R than 2:1?
🚀 Join us now and get fine-tuned stats you care about!
How to handle risk with the Dragonfly Doji pattern?
We analysed 4120 markets for the last 59 years and we found 209 590 occurrences of the Dragonfly Doji pattern.
On average markets printed 1 Dragonfly Doji pattern every 74 candles.
For 2:1 R/R trades, the longest winning streak observed was 81 and the longest losing streak was 580. A trading strategy relying solely on this pattern is not advised. Anyway, make sure to use proper risk management.
Keep in mind all these informations are for educational purposes only and are NOT financial advice.
If you want to learn more and deep dive into candlestick patterns performance statistics, I strongly recommend you follow the best available course about it. Joe Marwood (who's a famous trader with more than 45 000 Twitter followers) created an online course called "Candlestick Analysis For Professional Traders" in his Marwood Research University. There he will take you through the extensive backtesting of the 26 main candlestick patterns. He then summarizes which one is THE best pattern. Do you know which one it is?
Remember, don't trade if you don't know your stats. Click here to signup to the course now!
PS: Save 20% with the SAVE20 code.
What is the Dragonfly Doji candlestick pattern?
A Dragonfly Doji candlestick pattern is one of the four different types of Doji candlesticks.
This pattern is the most uncommon candlestick. It works with the main purpose of depicting the equilibrium situation of supply and demand. It means it signals an important reversal. Therefore, if you want a signal for a potential upside or downside reversal in price, Dragonfly Doji is a type of candlestick pattern you must be looking for.
Its function depends on past price action. Dragonfly Doji pattern has become incredibly popular in recent years like the rest of the candlestick patterns. The colorful bodies of such patterns put users on ease to read the behavior of the market and to make out different patterns.
How is the Dragonfly Doji pattern formed?
In the open market, a Dragonfly Doji pattern is formed when the price tussle is going on between bullish and bearish traders. It is formed when the bullish traders drive prices up and bearish traders reject high prices and try to push downwards. It is also formed in an inverse situation.
That means when bearish traders drive prices downwards while bullish traders push prices up.
During the tussle, the market explores both, upward and downward options but it rests in a state of equilibrium.
It never commits to any direction.
How to identify a Dragonfly Doji pattern?
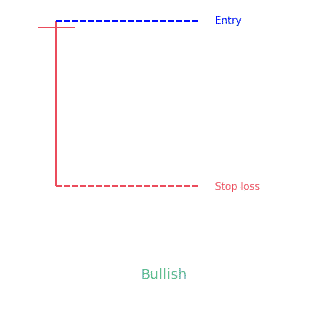
It is very easy to identify a Dragonfly Doji pattern in a candlestick chart because of the courtesy of its unique “T” shape.
The shape is the direct result of the opening of a trading day at a downtrend. And it is subsequently reversed in time to close near the opening price.
In short, you can spot a Dragonfly Doji by:
- Observing the candle when it opens and closes at the same price (Highly likely at the very similar level, although it is not necessary)
- Spotting a remarkably long lower wick
- Observing the absence of upper wick or close to the non-existence of upper wick
What does the Dragonfly Doji pattern tell traders?
Dragonfly Doji Pattern can be regarded as a sign of neutrality or indecision because neither buyers nor sellers can gain. Although, as we have discussed earlier, the Doji pattern signals an important reversal in prices. It tells the traders that the trend of the prices may change. But this may not be exact on many occasions. The reason is, there must have been a preceding downtrend for a Dragonfly Doji to indicate a potential reversal. However, to cut long story short, the long lower shadow of the Doji indicates that for at least part of the period, sellers were in a position to take control. That naturally increases the selling pressure during the period and that is a warning sign for the traders.
How to trade when you see the Dragonfly Doji?
There are several ways to trade when the traders see the Dragonfly Doji pattern. However, it is very difficult to trade a Dragonfly pattern because it is very rare on the charts. It is imperative to closely observe:
- The bullish uptrend that is a strong sign that prices may continue to the upside
- The bearish downtrend that is a possible signal of price reversal
- Sideways movements when the market consolidates
Precautions to take before following the Pattern
The Doji patterns do not provide enough information as a trader would like to have to make a decision. Traders must not trade an a single signal. Keep in mind to always consider other patterns and indicators along with Dragonfly Doji pattern. Traders shoud follow their trading plan and risk management at all time.
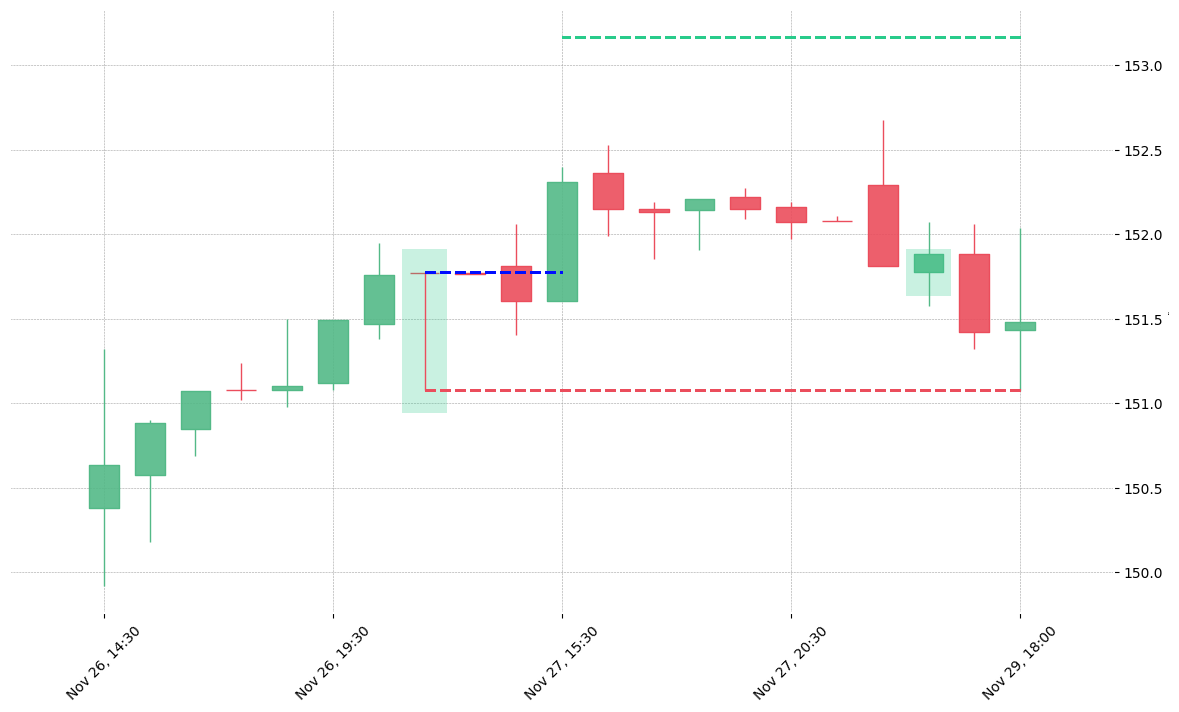
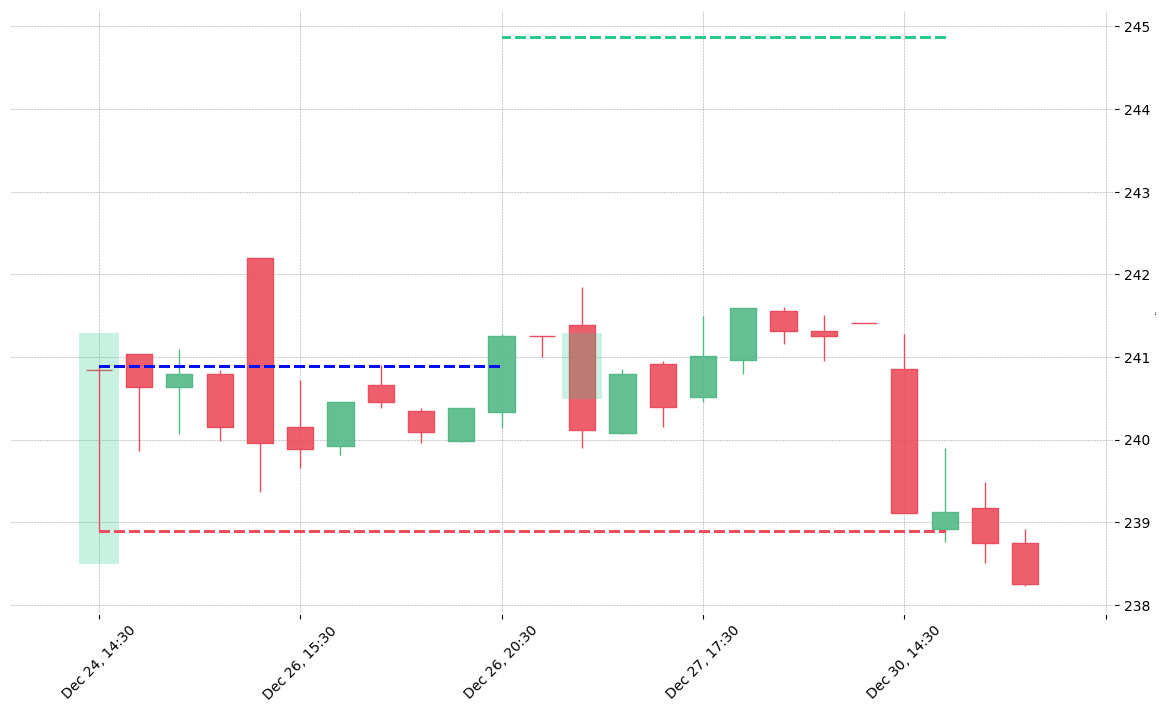
How does the Dragonfly Doji pattern look in real life?
Looking to learn more about this pattern?
You should take a look at Joe Marwood's online course. In his course, he backtested the 26 main candlestick patterns before to summarize which one is THE best pattern. I really liked his course and you shouldn't miss it!
Click here to signup to his "Candlestick Analysis For Professional Traders" course now!
PS: Save 20% with the SAVE20 code.