
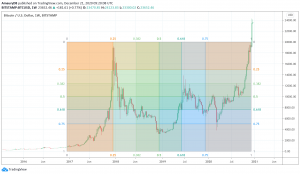
- The Gann Box also uses innovative geometrical and mathematical relations to help traders measure and identify the recurring price cycles.
- Price and time levels are the partitions equally divided by the Gann Box.
William Delbert Gann or WD Gann was an expert trader of the modern financial markets. He developed several technical analysis methods and also shared details for all and sundry to learn and trade successfully. He is an author of several books and courses for traders to learn share and commodity trading. Let’s dive into the Gann Box tool.
Gann technical analysis methods are a bit complicated because they are based on geometry, ancient mathematics, astrology, and astronomy. Popular technical methods like Gann Angles and the Master Charts are at Gann’s disposal. The Gann Box is also among the several powerful tools that Gann developed.
How does the Gann Box tool work?
The Gann Box also uses innovative geometrical and mathematical relations to help traders measure and identify the recurring price cycles. Users of the Gann Box must identify a cycle that is expected to repeat. In simple words, the box is like a Google map that helps masses to find their destination with ease and comfort. However, it is important to note that traders must scale properly to make sure that the market is having a square relationship.
Price and time levels are two important elements of the Gann Box. Price and time levels are the partitions equally divided by the box. A major pivot point, either high or low, is the mark from where the tool starts to draw its two elements.
How to use the tool?
The use of the Gann Box is quite simple. There are several tools available in the market that can help traders to draw the box on a chart. Traders can use a single tool or a combination of tools to find the best trades available in the market. However, traders need to set the exact price and time levels as per their trading strategy and preferences to successful trading through the box.
The drawback of the Gann Box and how to cover it
Gann technical analysis methods are complicated for too many people because of the involvement of angles, numbers, astronomy, and astrology. Moreover, the tool offers no clear instructions on how to use it. Traders can cover those drawbacks with the help of tools and techniques that help traders to draw the Gann Box on charts. One such technique that we want to share with you is the Rise/Run ratio.
As we have already discussed that a major pivot point, either high or low, is the point from where the tool starts to draw price and time levels. The Rise is the amount of price from the pivot point while the Run is the number of bars from the pivot point. The Rise/Run ratio of 1 or multiple of 1 gives the best results. 1, 2, 5, 10, 20, 40, and 2.5 are among the preferred ratios. The angles generated through these preferred ratios also enable traders to identify the levels of support and resistance as the market marches on into the future.