
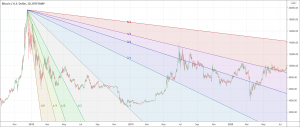
- As its name suggests, W.D. Gann developped the Gann Fan
- The Gann Fan is composed of a serie of lines following specific angles.
- Traders draw the Fan from a low or high points and line are seen as future potential support and resistance lines.
Have you ever wondered whether geometrical angles have the solution to how forex markets work? The answer is yes. Geometrical angles do offer the solutions to forex market riddles and help us in trading. Gann Fan is an interesting trading tool that works through a group of lines and angles. William Delbert Gann designed the Gann Fan tool because he believed that the forex market also moves in accordance with the laws of geometry.
The basics of Gann Fans
Principles
The Gann fan tool consists of 9 diagonal lines designed to show support and resistance areas on a chart. Main tops and main bottoms are the areas from where those angles are drawn. These angles function to divide time and price proportionately. Technical analysts and traders use them to predict areas of support and resistance, future price moves, and key tops and bottoms. It is important to note that the proper scaling of the chart is absolutely essential to ensure the market has a square relationship.
Important angles
The Gann Fan theory has its basis on the notion that markets rotate from one angle to the other as price moves to the next when one angle is broken. 1 × 1 or the 45 angle is the most important angle representing one unit of price for one unit of time. The selection of 45 angle as an ideal angle is based on the belief that the trading market is predictable, geometric, and cyclical. The 45 angle also ascends one point with each passing day. Other important angles are:
- The 2×1 or 26.5 that moves two points each day.
- The 3×1 or 18.75 that moves three points each day.
- The 4×1 or 15 that moves four points each day.
- The 8×1 or 7.1 that moves eight points each day.
The corresponding Gann fan angles for the decreasing values are:
- The 1×2 or 65.75
- The 1×3 or 71.25
- The 1×4 or 75
- The 1×8 or 82.5
45 is a strong value
There are four angles above and four below the ideal angle of 45. All angle lines originate from the same price point and extend into the future at different levels. The resulting shape resembles a Chinese hand fan and that is why its name is Gann fan.
Those angles originate from price top or price bottom and help to identify a trend after the reversal of a given security’s trend. When the market reaches an equal unit of time and price, up or down, it indicates that a change in the direction of the price is imminent. Traders and technical analysts consider it a bullish market if the price remains above the upwards angle during an uptrend and vice versa.
How to use the Gann fans?
It is very interesting to know the answer to the question that how to use the Gann fans for trading and technical analysis. Traders mainly use the Gann fans to identify levels of support and resistance and predict future movements of prices. How do they do? Let us try to understand it through an example. Let us suppose that the price is staying in the space above an ascending angle and doesn’t break below that particular level, then this scenario suggests that the current trend in the market is bullish. Similarly, if the price stays below a descending angle and doesn’t break above that particular level, this scenario indicates that there is a bearish trend in the market.
According to the theory of Gann, the price level is most likely to jump to the nearest angle above it whenever an uptrending price reverses and breaks under an ascending angle. Similarly, the price level is most likely to jump to the nearest angle above it whenever a down-trending price reverses and breaks up through a descending angle.
As far as continuation and consolidation pattern is concerned, when two Gann fans combine to establish effective support or resistance level, a continuation or consolidation pattern appears. It is also interesting to note that whenever prices get bound between two angles bigger than the ideal 45 angle, it is an indication of the bullish trend in the market. Conversely, the prices of a bearish market get bound in angles lower than the ideal 45 angle.
How to trade with the Gann fans?
Gann fan trading strategies are very interesting. To execute Gann fan trading strategies, it is essential to understand the basics of the Gann fan theory and angles. Traders may follow the following suggestions in order to trade with the Gann fans.
Gann fan trade entry
Trading breakouts and anticipating bouncing from the diagonal lines are the two possible alternatives for Gann fan trade entry. In order to trade breakouts, traders should open trade in the direction of the breakout whenever prices breakthrough any of the nine Gann fan angles. However, traders must not hurry to initiate a trade as soon as the first candle closes beyond a Gann fan line. They should be patient and wait for the second confirmation candle to break through a line. It is necessary because interactions with the levels are not always accurate and traders may fall into a trap. In order to tradeline bounces, traders can initiate trading whenever the price bounces from a line. However, it is again necessary to wait for confirmation.
Gann fan stop-loss
Placing a stop-loss is very crucial in any type of leverage trading to remain on the safe end. Traders may use the following suggestions to place stop-losses when trading with Gann fans.
- When trading Gann line breakouts, traders can place a stop-loss above/ below a prior top/bottom on the chart.
- When trading the Gann line bounces, traders can place the stop-loss above/ below the top/bottom of the most recent swing created at the time of bounce.
Gann fan profit-taking
Taking a profit strategy when trading Gann fan breakouts suggests that traders should remain in the trade and wait for the prices to reach the next Gann fan support or resistance level. On the other hand, taking a profit strategy when trading bounces advises traders to remain in the trade and wait for the prices to reach the prior Gann fan support or resistance level.
Conclusion
W.D. Gann introduced the Gann fan theory. The theory revolves around a series of angle lines known as Gann fan angles. Gann believed that the angle of 45 was the most crucial angle regarding the balance of time and price. Other Gann fan angles include 82.5, 75, 71.25, 63.75, 26.25, 18.75, 15, and 7.5.
Technical analysts and traders use those angles to predict areas of support and resistance, future price moves, and key tops and bottoms. Gann fan theory also suggests that price action creates certain Gann fan angles that act as support or resistance levels on the chart. The theory also holds that trends inclining on 45 degrees are more reliable and sustainable. The Gann fan trading strategy is also very interesting. Traders can enter a trade, place stop-loss, and take profit using that strategy.
However, just like the other technical analysis and trading tools, the Gann fan has also certain limitations. Therefore, traders should use it in conjunction with other technical indicators, price action tools, and other forms of technical analysis.