
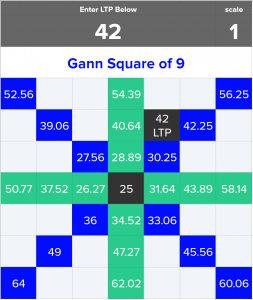
- The Gann Square of Nine defines important levels where price might shoot and retrace.
- Numbers in the square are arranged in ascending order starting from 1 as we have already discussed.
- The most important numbers in the Gann Square of Nine occur every 45° on nine chart.
Traders have been using Gann studies for decades. They are a popular method of observing an asset‘s direction even today despite the fact that futures and stock markets have changed significantly. The Gann Square is also a very popular technical analysis tool that is based on time and price symmetry. WD Gann developed it and it is a cornerstone of his trading techniques. The Gann Square tool is an advanced tool that requires a thorough knowledge and understanding of the Gann Theory and charting.
The Gann Square is also known as Gann Square of Nine because the number 9 represents the completion of the first square. It indicates 81 (9 × 9) numbers in a geometrical structure. The Square of Nine has a certain geometrical structure just like the price patterns following a certain geometrical structure. Gann formulated those patterns in Gann Theory.
The value “1” starting at the center is the initial value of the square of 9 is a spiral of numbers. Starting from the initial value, the number increases with the movement in spiral form and clockwise direction. Expert traders and technical analysts consider each point on the Square of nine a vibration point.
How to use the Gann Square?
There are multiple ways to use the Square tool. One way to use it is to start at the previous main pivot point so that the 1 × 1 line follows the areas of the current market support to a good degree. Highlighting geometric formation forecasting key support and resistance levels by counting forward all time lows or high points is the other way to use the Square.
The most important numbers in the Gann Square of Nine occur every 45° on nine chart. The following are key numbers of importance.
- 0 or 360° with 2, 11, 28, 53, and so on.
- 45° with 3, 13, 31, 57, 91, and so on.
- 90° with 4, 15, 34, 61, 96, and so on.
- 180° with 6, 19, 40, 69, and so on.
The construction of the Square of Nine
As we know that square is the basic form of the Square of Nine. Numbers in the square are arranged in ascending order starting from 1 as we have already discussed. The trend of the market decides whether to arrange numbers in a clock wise or anti-clock wise manner starting from middle to right and up. Upward trend demands clockwise while a downtrend requires anti-clockwise number arrangement. Moreover, the Square of Nine gives important cardinal and ordinal levels. Numbers falling on both of these levels are always major vibration points because they represent important support or resistance levels. However, it is crucial to remember that all the important numbers in the Gann Square of Nine occur every 45° on nine chart.
How to calculate the Gann Square of Nine
All the numbers in a Gann Square also follow a certain pattern. Traders can follow the following example to calculate.
Suppose we have a number 51 in a Square of Nine. Calculate the square root of 51 equals to 7.15. Now subtract 2 from the result. Subtract 2 because 26 is -360 of 51 in the Square. It gives 5.15. In the next step, take a square root of the previous step’s result and the answer will be 26. Hence, the next value near 51 will be 26.
Want to know more about the Gann Square?
Do you want to learn more about the Square of Nine?
You should check this Gann Square Trading course on Udemy.
It’ll teach the following skills:
- How to use the Square as a predictive indicator
- What are the important levels
- How to use the Square of Nine to enter or exit a trade
Click here to enroll now for the course “Certification in Gann Square Trading”!