
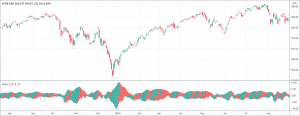
- The Gator Oscillator helps to observe the degree of convergence/divergence of the balance lines.
- It’s supplementary tool of the Alligator Oscillator.
The Gator Oscillator (GO) is a technical analysis tool that helps to observe the degree of convergence/divergence of the balance lines. In simple words, it makes it easier for the traders to assess when a market is trending, and when a market is range-bound. Thus, it helps to improve the timing of trades.
Bill Williams first introduced the Gator Oscillator. He was a great technical analyst and trader who developed other tools as well. He developed the GO to expand on one of his other indicators named as the Alligator Oscillator. The Alligator Oscillator plots three balance lines to show its readings. The Gator Oscillator works in combination with the Alligator Oscillator to instantly recap those three balance lines.
How does the Gator Oscillator work?
The Gator Oscillator works as a supplementary tool of the Alligator Oscillator. It helps to recap the following three balance lines plotted by the Alligator Oscillator.
- Blue Alligator’s jaw is a 13-period simple moving average (SMA) 8 bar forward
- Red Alligator’s teeth is a 9-period simple moving average 5 bars forward
- Green Alligator’s lip is a 5-period simple moving average 3 bars forward
The purpose of the GO is to show the degree of convergence/divergence of those balance lines. It shows its reading using two bars, the top bar, and the bottom bar. The top bar represents the difference between the blue jaw and red teeth lines. The bottom bar depicts the difference between the red teeth and the green lip line. The GO calculates and shifts the balance lines into the future according to the amount set by the traders. If the moving averages get plotted on the charts, the jaw will be blue, the teeth will be in red, and the lip will be green. The Gator Oscillator’s bars can be either red or green. A green bar depicts the rise while the red bar indicates a fall. It has also four stages that are also important to know about in order to interpret the indicator.
How go interpret the Gator Oscillator?
The interpretation of the Gator Oscillator demands traders to know about the four stages of the oscillator.
- The Gator Oscillator is in sleeping mode when there are red bars on either side of the naught line.
- The GO indicator is in awakening mode when one sidebar turns green while the remains red.
- The indicator is in the eating phase when there are green bars on either side and hence the difference between the two sets of moving averages also grows.
- The Gator Oscillator is a sated mode when one of the two sides turns red again. It generally indicates a decelerating trend and also preceded an upcoming reversal of the trend.
How to trade with the indicator?
The Gator Oscillator is most effective for trading in trending market conditions. Generally, traders open positions when the indicator awakes and keep through the trend exhaustion phase until both sides turn red again. Traders may also follow a more conservative strategy. They can lock in profits and exit their position when the Gator Oscillator is sated. This approach reduces the risk as well as the overall gain.