
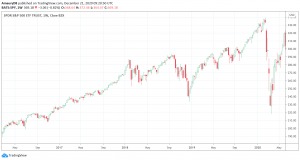
- There are two types of candlesticks, hollow candlesticks and filled candlestick.
- Candlesticks also tell us about the strength of a trend in the market.
- The hollow candlesticks tell us that the trend is strengthening as prices move higher after the open.
Different types of candlesticks representation
Traders have been using candlestick patterns for years in financial trading to display on charts the underlying symbol’s price data. There are two types of candlesticks, hollow candlesticks and filled candlestick. The hollow candlesticks indicate that prices moved higher after the open. Conversely, the filled candlestick conveys that prices moved lower after the open.
Candlesticks also tell us about the strength of a trend in the market. The hollow candlesticks tell us that the trend is strengthening as prices move higher after the open. On the other hand, filled candlesticks tell us that a trend is weakening as prices move lower after the open. This is very significant information for traders to analyze the market and for successfully trading in the market.
The shape of the Hollow candlesticks
As we know that each candlestick has a body and it tells traders whether the market improved or not. The appearance of the candle indicates the price action throughout the day. Traders can visualize all this information in the candlestick shapes. The hollow candlesticks also convey fruitful information through their appearances.
- A long hollow body of a hollow candlestick suggests that prices moved significantly higher in a single trading day. It tells that buying pressure is enough to push the candle higher.
- A Doji (a line across the middle of the shadow) suggests that opening and closing prices are at the same or almost at the same level. It usually tells a balanced market at that price.
Shadows of the Hollow candlesticks
Shadows of a candlestick, also known as wicks, indicate how far the prices moved away from open and close. The shadows or wicks of a Hollow candlestick may mean different things such as:
- A Hollow candle with a long shadow above signals bearish sentiment in the market. It tells traders that there is very little support at a higher level.
- A Hollow candle with a short shadow above indicates bullish sentiment in the market. It tells traders that the high was near to the close.
- A Hollow candle with no shadows above suggests a very strong bullish trend in the market because prices moved high all day and closed at the highest high.
- A Hollow candle with a small shadow below means the price moved slightly lower but then moved up higher than the open and closed at a higher level. Again this is an indication of a bullish trend in the market.
- A Hollow candle with a long shadow below also indicates a bullish trend. It forms when prices move lower significantly during the day but after a buying pressure prices move up above the open.