
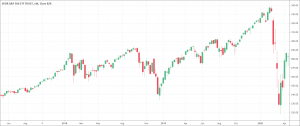
- Charts depict price evolution over a specific period of time.
- It can be drawn in many ways (line, candlestick, …)
- It can show different timeframe (price every 1 hour, 1 day, 1 week, …)
To succeed in today’s financial world, the right knowledge and right skills are imperative. Similarly, knowledge of stock charts and the skill to read stock charts are prerequisites of investing and trading. Understanding how to read stock charts is the key that leads to perfect technical analysis. Inversely, if you do not understand how to read stock charts, you cannot perform technical analysis. The door of success in financial trading closes even before it ever opened.
Why is it important to know how to read stock charts? It is important because reading and interpreting stock charts bring numerous opportunities. It may bring intraday or swing trading opportunities. It also helps to analyze how a stock has performed over a particular period of time and how it might perform in the future. That is why it is important to understand how to read stock charts for beginners before entering the arena of financial trading.
Company financial information a stock chart depicts
As we know the stock chart of a particular company’s stock depicts a lot of information about the stock. It generally shows data about historical highs and lows, day high and low dividend per share, P/E ratio, open price, close price, and other financial information of the company. It is very important to know before understanding how to read stock charts.
Ticker Symbol
The ticker symbol is a symbol that companies use to delineate their stocks. For example, Apple’s and Microsoft’s ticker symbols are AAPL and MSFT respectively. Ticker symbols are usually found in the ticker column or maybe in parenthesis right next to the name of the company.
52-week high and low
The trajectory of stock on stock charts depicts key metrics of 52-week high and low. This trajectory shows the highest and the lowest prices of the stock during the past 52 weeks.
Stock charts also show the dividend per share and dividend yield of all those companies who pay out dividends.
P/E ratio
Price to earnings ratio is another important metric that a stock chart depicts. It is calculated by dividing the stock’s current price by the earnings per share of the previous year.
Day high and low
Stock charts also depict the highest and the lowest prices of the stocks during a trading day. They must not be confused with open and close prices.
Open and close price
Open price is a simple figure at which the stock opened trading at the start of any given day. The closing price is a much important metric that shows the price at which stock stopped trading at the end of the normal trading hours.
Net change
Net change is a measure of dollar value change of stock from the previous close price.
How do stock charts depict prices?
The price of a stock is depicted on stock charts in the following different ways.
Line charts
Line charts depict stock price with a single point at a given point during its trading day. The price it depicts is typically the closing price. The connection of each price point to the adjacent price point makes a line that appears on the line chart.
Bar charts
Bar charts are a bit more complex. Bar tells about four major points – opening price, closing price, high of the day, and low of the day. The vertical line depicts the range of stock. A horizontal line pointing left marks the opening price. A horizontal line pointing right marks the closing price.
Candlestick charts
Candlestick charts are even more complex than bar charts. They are packed with a lot of information. Here, the color of each candlestick is also important. The color depicts whether the stock price closed below or above its opening price. On the other hand, the body of the candlestick shows the trading range from open to close.
How to read stock charts?
After a brief description of the basics, we can now discuss how to read stock charts. The following discussion is going to help big in your task, so don’t just read, instead, grasp the ideas.
Identify the chart
Identify the chart of a company of your choice to look for its financial information. A ticker symbol can help you identify the right stock chart. It is crucial to correctly identify the stock chart, so make sure before advancing in further reading of the chart.
Choose a timeframe
Choose a timeframe of your choice, daily, weekly, monthly, or yearly. Looking at different timeframes helps to analyze the short and long-term performance of the stock. Checking for consolidation is also crucial. Remember and note any day’s price, search for consolidation in the following days, and check whether that day’s price is above or below the price.
Track stock price
A stock chart consists of two sections, an upper and smaller lower section. The lower section is important to track prices. The upper section tracks the change in stock price. It is important to note that prices are often depicted in different colors. Remember that stock prices are depicted on stock charts in different ways. It may be a line, a bar, or a candlestick.
Identify trading volume
Trading volume is another key metric to look at while reading the stock charts. Stock charts generally indicate volume at the very bottom in green and red bars. Here the key is to keenly look for the spikes in trading volume. It is important because spikes indicate the strength of a trend in the market. Here you can notice whether the stock is trading up or down. For example, if the price of a stock is falling but the trading volume is high, it indicates a strong downtrend in the market and vice versa.
Identify areas of support and resistance
Areas of support and resistance are very crucial in technical analysis. They are another most important metrics that you can read on stock charts. Areas of support and resistance means those areas where stock prices fall after the rise or decline. Support is the area the stock doesn’t drop beneath. That means it supports the stock when its prices are falling and keeps it from dropping below that price. Conversely, resistance is the area the stock doesn’t go beyond. That means it keeps prices away from pushing through the top price levels. Identification of areas of support and resistance is crucial for prediction or understanding of the stock trends. It also helps to forecast when the stock prices might go up or down.
Bottom line
Those are the basics of how to read stock charts for beginners. Learning how to read stock charts is as important in financial trading as breathing for living. Always remember that majority of big market players rely on stock charts to see a clear picture of stock price movements. Condensed information available on the stock charts gives traders an edge when they make trading and investing decisions.
The verdict is, stock charts are powerful tools that offer a lot of information. Now, it depends on you whether you can read that information or not. Therefore, learning how to read stock charts for beginners is a prerequisite to giving yourself a better chance of success.