
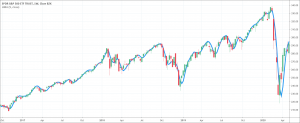
- The Hull moving average indicator or HMA indicator helps to identify the current trend in the market.
- It is an extremely fast and smooth moving average.
The Hull moving average indicator or HMA indicator helps to identify the current trend in the market. Allan Hill discovered the HMA indicator. It differs from the simple moving averages in the sense that its curve is more smooth. It strictly follows the price activity because the purpose of the HMA indicator is to reduce the lag between itself and the price. That is the reason that it is an extremely fast and smooth moving average indicator. The HMA indicator suits well for the middle to long-term trading.
Before you keep looking down this article, you should check 2 of courses I shortlisted in the New Trader University from Steve Burns (a very famous trader with about 400k followers on Twitter)!
- Moving Averages 101: this professional video series that will teach you how to use moving averages to be more profitable with less stress.
- Moving Average Signals: this course will illustrate how trading moving average signals with confidence and consistency can lead to profitability; consistently creating bigger wins and smaller losses.
The procedure and formula to calculate the Hull moving average
First of all, a weighted moving average is calculated with a period n/2 and then it is multiplied by 2. Then the moving average for period n is calculated and it is subtracted from the prior calculation. Now, the weighted moving average is calculated with period square root using the calculations from the prior step. The formula for the HMA indicator is;
Hull moving average = Weighted moving average {2 ×weighted moving average (n/2) – weighted moving average (n)}, square root (n)
What does the Hull moving average tell traders?
The Hull moving average indicator is an indicator that is very easy to use. It gives traders and technical analysts an accurate reading about the current trend in the market. The higher movement of the blue line on the chart, which shows the HMA, points to an uptrend in the market. On the other hand, the lower movement of the blue line indicates a downtrend in the market. The rapid change in the direction of the line indicates a sideways trend.
How to trade with the indicator?
The use of the Hull moving average indicator is not complicated. It is very easy to trade with the HMA indicator. There are multiple ways to use the Hull moving average for trading such as;
- If the blue line starts to move up, it is time to buy. Traders have a choice to enter immediately or place a buy stop pending order slightly above the high of the candlestick that causes the HMA line to move up.
- On the other hand, if the blue line starts to move down, it is the best time to sell. Traders can either enter the selling market or place a sell stop just below the low of the candlestick that causes the HMA to move low.
- The Hull moving average crossover is another best strategy that works well with the Hull moving average indicator. An uptrend is there if the fast HMA crosses the slower HMA on the upside. Conversely, a downtrend is there if the fast HMA crosses the slower one on the downside. Traders should wait for the crossover to initiate a trade. It is a prudent strategy to place a buy stop order just above the high of the confirmation candlestick and to place a stop-loss a few points below its low. For a sell strategy, it is always wise to place a sell stop just below the low of the confirmation candle and place stop-loss a few points above the high of that candle.

Before you go, check this two tremendous courses to expand your understanding of the moving averages: Moving Averages 101 & Moving Average Signals.
They both are created by Steve Burns. You surely saw him on Twitter as he has about 400000 followers. These courses will teach you how to use moving averages to be more profitable with less stress.