
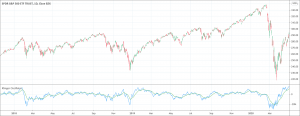
- The Klinger volume oscillator is a volume-based indicator.
- It identifies long-term trends of money flow of a particular security.
The Klinger volume oscillator is a volume-based indicator that functions to identify long-term trends of money flow of a particular security. It also remains very sensitive to short-term fluctuations and is always predictive of short-term reversals of the trends. The Klinger volume works on the basis of comparing the volume flowing in and out of security to price movement. The calculations and the indicator’s formula are very complex because of the involvement of the difference of two moving averages of force volumes and different timeframes.
Stephen J. Klinger developed the Klinger volume oscillator. It employs high, low, close, and volume to generate a volume force. This volume force then turns into an oscillator by getting a fast exponential moving average of the volume force and subtracting from it a slow exponential moving average of the volume force. It consists of two lines, usually red and blue in color, fluctuating above and below the zero line. The red line represents Klinger while the blue line is the signal line. The 13-periods moving average is the by default signal line that helps to identify times to buy or sell. The indicator revolves around the concept that how volume is flowing through an asset and how the short-term and long-term prices are affected by it.
Calculations and the Klinger volume indicator’s formula
The calculations and the Klinger volume indicator’s formula is complex and traders do not need to comprehend it. Instead, they need to fully understand how to interpret the indicator. However, we are going to share the basics of the calculations and the Klinger volume indicator’s formula. The first step involves the calculation of the volume oscillator by subtracting the 34-period exponential moving average of the volume force from the 55-period exponential moving average of the volume force. We can calculate the volume force by using the following formula.
Volume force = V × [2 × { (dm / cm) – 1}] × T × 100
Where V and T represent volume and trend respectively. The trend calculation has the following formula.
Trend = +1 if (H + L + C) > ( H<-1> + L<-1> + C<-1>)
What does the Klinger volume indicator tell traders?
The Klinger volume indicator is a very useful and powerful indicator of technical analysis. As it consists of two lines moving averages, we observe many interactions between the lines. It signals an eventual move of the prices in the direction of the cross whenever the Klinger volume line crosses the 13-period moving average line.
Identifying divergence is another important function of the indicator. When the price is rising and the Klinger volume is negative, it is a signal of bearish divergence. Conversely, when the price is falling but the KV is positive, it is a signal of bullish divergence.
How to trade with the Klinger volume indicator?
As we have discussed earlier that the Klinger volume indicator uses two lines, red and blue. Whenever an indicator consists of two lines, the crossover of the two lines is the most important signal. So, the crossover of the signal line and the Klinger volume line is the most basic signal to look for. Another important thing to notice is when the two lines pass the centerline.
A crossover between the two lines while being below the centerline is a signal to buy. Conversely, a crossover between the two lines while being above the centerline is a signal to sell.
Moreover, when the indicator moves above the signal line from below during an overall uptrend, traders can buy. Conversely, when the indicator moves below the signal line during an overall downtrend, traders can sell.
The limitations of the indicator
Klinger volume indicator provides crossover and divergence signals which are both risky signals. The reason is that both are prone to provide false signals. Moreover, crossovers occur very frequently and it gets very difficult to filter out useful signals. Zero-line crossovers also offer similar problems because the indicator may cross the zero-line multiple times before going in a particular direction. It may also happen that the indicator fails to follow the price action and traders lose a favorable trading opportunity.
Divergences have also the problems because all price reversals may not show divergences. Divergences may also occur too late and cost traders heavily. Therefore, traders must be aware of the limitations of the Klinger volume indicator and use it in conjunction with other technical analysis tools for confirmation.
Conclusion
Klinger volume indicator is a volume-based oscillator that relies on the volume force. It takes into consideration factors like high, low, close, and volume to generate the volume force. The indicator consists of two lines and a zero-line to provide signals. Buying/selling and divergence signals are the most prominent signals that the indicator provides. Traders look for a divergence to identify potential price reversal signals. Although this indicator is a powerful and reliable indicator, it has also certain limitations. That is the reason that traders use other technical analysis tools such as trendline and moving averages in conjunction with the Klinger volume indicator for confirmation.