
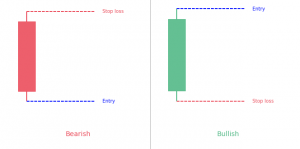
- The Long Line candlestick pattern is a 1-bar pattern.
- It simply consists of a long body candle.
- It can be bearish or bullish.
What is a long line candle?
Candlesticks provide different visual hints on the trading charts for a better and easy understanding of the price action. The candlestick chart patterns are a great add to traditional chart patterns because of their functionality and reliability. A candle consists of a body and upper or lower shadow or a wick. Candles can either be bullish or bearish. A bullish candle is formed when the price closes higher than it opened and it has a white color. When the price closes lower than its opening level, it is a bearish candle with black color. Now, the size of a candle is also important. Technical analysts and experts consider bigger candlesticks more reliable and support and resistance levels, associated with the candles, stronger. Moreover, a candle is short when the market volatility is low and it will be a long line when the volatility will be high.
What is a long line candle and long line candlestick pattern?
The long line candles are the candles with a very long real body. The long line candle suggests that there is a very huge difference between the opening and closing prices of the assets. That also means that prices greatly increased or decreased during the trading session. If the long line candle is very long and it also has an opposite color to the preceding candles, it indicates a reversal of the current trend in the market. A trading pattern that is based on the long line candle is known as the long line candlestick pattern.
How to identify a long line candlestick pattern?
It is not a difficult task to identify a long line candlestick. In order to assess whether the real body of the candle is long enough or not, traders just need to observe the real bodies of the previous candles. The long line candle must have a body longer than the average of the previous real bodies.
Types of the long line candlestick patterns?
The long line candlestick patterns are of the following two types.
Long white candlestick pattern
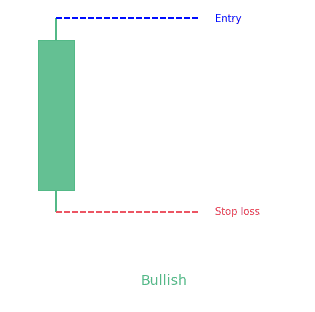
A long white candlestick consists of a white body and upper and lower shadow where both of the shadows must be smaller than the real body. It should also be at least three times higher than the average size of the previous 5 to 10 candles on the chart. The appearance of the long white candle after a series of declines suggests an upcoming change in the current trend. Most of the traders consider it a bullish candle but it is not true because it can be a part of both, bullish and bearish patterns.
Long black candlestick pattern
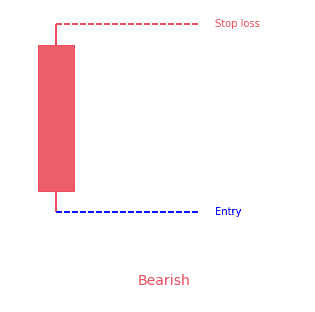
A long black candlestick consists of a long black body and upper and lower shadow where both of the shadows must be smaller than the real body. It should also be at least three times higher than the average size of the previous 5 to 10 candles on the chart. The occurrence of the long black candlestick pattern in an uptrend indicates an upcoming bearish reversal in the trend.
Conclusion
Both types of long line candlestick patterns are significant for technical analysis and trading purposes. Both of them give significant insight into the activities in the market. However, it is always rational to use the long line candlestick pattern in conjunction with other technical indicators. It helps traders get further confirmation (and is always a good thing).