
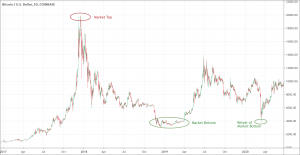
- Top
- It’s a transition from buying pressure to selling pressure is known as the market top.
- It often forms a double top (price checks the previously established extreme high).
- Bottom
- The market bottom is the end of the bearish or downward trend and the beginning of a bullish trend in the market.
- A bottom appears after a very long and mature downtrend marked by tiredness and technical exhaustion.
- It oftens forms a double bottom (price checks the previously established extreme low).
Market top and market bottom are were the trend reverse.
What are they and how to spot them?
The market top
What is it?
Trading analysis is a trading discipline to analyze and evaluate investments. It also helps to identify trading opportunities. It is all possible to analyze statistical trends that we get through trading activities such as price movement and volume.
When prices reach a high, then a higher high, and finally a lower high, it is an event known as “top” in technical analysis. All the highs signify the following;
- A high indicates that the buying pressure was greater than the selling pressure.
- A higher-high signifies that the buying was still greater than the selling.
- A lower high suggests that the selling pressure is too dominant and will not let prices rise to the level of the previous high.
This transition from buying pressure to selling pressure is known as the market top. It is not a dramatic event that occurs all of a sudden. The market gradually reaches the highest point and maintains it for some time usually a few years. Subsequently, it begins to fall slowly or rapidly. The reason behind the top is the imbalance between supply and demand. The top occurs when the buying pressure cannot compete with the selling pressure and gradually the buying wanes. Moreover, a rally of at least nine months is compulsory for a top to form.
How to identify a market top when you see one?
There are three main indicators that help to identify a market top.
- Despite the growth in indexes, the 52 weeks highs’ number continues its fall indicating that there are very few stocks at the moment who working to push the prices high. It shows the dominance of the selling pressure.
- The uptrend of the New York Stock Exchange has reached the highest point and has now begun to fall indicating that the overall market is losing control, even though some of the market indexes continue to rise.
- The final blow to the market happens when the indexes also decline below a prior swing low. The uptrend fails when the prices struggle to make higher high or lower low than the previous low in the upward trend. This third signal ultimately provides the timing indicator.
The market bottom
What is it?
The market bottom is the end of the bearish or downward trend and the beginning of a bullish trend in the market. It is a very complex and difficult task to identify the market bottom (the process that is also known as bottom picking) before it is over. The change in trend may be a very short one and the original downward trend might continue.
The bottom occurs as a result of an imbalance in the market. When the demands exceed the supply, a temporary uptrend occurs that might not last for long. The market bottom gives so many trading opportunities to make profits. However, bottom fishing is a quite risky and dangerous strategy that may not suit many traders.
How to identify a market bottom when you see one?
The difficulty of bottom picking stems from traders’ inability to grasp what is happening in the market. It is important to understand that identify a low is different from bottom picking or identifying a bottom. The low is simply the lowest point that price touches during a certain time period. On the other hand, the market bottom is a low or a series of lows that reflect the mentality of the investors indicating a shift in focus from selling to buying.
In order to pick a bottom for bottom fishing, it is a great plus to know how the Point and Figure chart works. The P&F chart is a simple and objective tool to visualize the bottom. The market bottom has two components floor and bottom that are represented by support and resistance on a price chart respectively. The P&F chart is more useful for bottom picking because it has the extraordinary ability to eliminate trading noise. When trading breaks above the ceiling and maintains its position above for at least a couple of weeks.
Now, it is also important to know why a market bottom appears. A bottom appears after a very long and mature downtrend marked by tiredness and technical exhaustion. The momentum indicators such as the 14-day relative strength index (RSI) or MACD or other volume indicators may indicate a bullish reversal. As a general rule, a bullish divergence occurs once the prices make a lower low despite the higher low indication of the indicator. On the other hand, the bottom’s exhaustion is marked by downside volume and strong bearish sentiment.
Conclusion
The market top and market bottom are the market analysis techniques used in the technical analysistr. The identification of the top and bottom is a tricky one. The top occurs after a strong uptrend while the bottom occurs after the maturity of a downtrend. When the three signals, discussed in the market top section, combine, there is a strong possibility of market correction after the top. A P&F chart is a great tool for bottom picking. However, technical analysts and expert traders suggest avoiding bottom fishing because it is too risky. Moreover, in order to do bottom fishing, it is imperative to collect sufficient evidence before engaging. The top and bottom are really helpful because there are more chances of successful trading when you trade with the trend. The famous forex saying is true after all, “The trend is your friend.”