
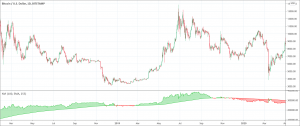
- The Negative Volume Index (NVI) indicator shows how down volume days impact price.
- It aims at reflecting the mindset of the smart money professionals.
Paul Dysart invented the Negative Volume Index (NVI) indicator. It watches the trade volume and Paul considered trade volume the most important market indicator. The NVI indicator highlights the days and weeks during which the trading volume decreases. It also compares price changes on those days.
As we already know that experts trade during relatively quiet periods of decreasing volume. On the other hand, novices and unprofessional traders get active during periods of rising volume. Therefore, the activity during the periods of declining volume should better reflect the thinking of the smart-money professionals. And that is exactly the idea behind the development of the Negative Volume Index to reflect the mindset of the smart money professionals who involve in trading during periods of declining volume.
How to calculate the Negative Volume Index?
Traders can calculate the NVI for any time period ranging from minutes to months. Traders can also calculate the NVI using any market index, commodity, or stock. The calculation of the NVI indicator depends on how the volume has changed from the trading volume of the previous day. However, the NVI will only change when the negative changes take place. That means the NVI indicator will calculate only if the current volume is lower than the previous day. The formula for the Negative Volume Index is:
Negative Volume Index = Previous NVI + {(Today’s Closing Price – Yesterday’s Closing Price) / Yesterday’s Closing Price × Previous NVI}
How does the NVI indicator work?
The Negative Volume Index relies on the volume. Volume is the basis of the working of the NVI indicator. The volume acts as a qualifier to decide whether or not to include today’s fractional ratio of net price change in the cumulative total. If today’s volume is less than the volume of yesterday, it is included in the cumulative total. On the other hand, if today’s volume is higher than the volume of yesterday, it is not included in the cumulative total. Hence, we can define the Negative Volume Index as a cumulative total of fractional ratios of net price change for decreasing volume days only. Hence, it tracks the changes in trading volume and it only considers decreasing volume as a positive indicator.
What does the Negative Volume Index tell traders?
Dysart developed the NVI indicator to give buying signals of an asset when the price is increasing but the volume is decreasing. It does so according to the premise that decreasing volumes are due to informed traders. Therefore, the increase in the NVI is an indication of smart-money buying and it tells traders to buy the stocks.
Moreover, crossovers with a signal line of a 255-period moving average of the NVI indicate trend reversals. When the NVI is above the 255-period moving average mark, it suggests a bull market. The NVI below the 255-period moving average indicates the bearish sentiment. The Negative Volume Index gives buy signals when the NVI is above the 255-period moving average. It issues sell signals when the NVI crosses below the 255-period moving average.